Abstract
With the BBC on an ongoing mission to serve the population they have directed their attention to evolving the organisation to being “digital first”. This follows the rise in media being consumed over the internet and has led to most of the BBC’s offerings being online. While this gives the BBC more opportunities to better serve audiences, online threats are also evolving. With the ongoing international tensions and the BBC being a prominent Public Service Broadcaster the BBC is facing greater security risks than ever before. The BBC’s Information Security department is responsible for mitigating these online threats, with social engineering and employees being a big factor in cyber-security. This assignment follows the development of a new internal application developed by the Corporate Digital & Applications team to help identify areas of weak security policy knowledge within the company. This assignment critically explores the constantly evolving technology, techniques and methodologies available to developers in industry to best achieve a solution in the confines of a public service broadcaster. Use-cases and scenarios are used in conjunction with prototyping to develop and refine broad initial requirements. A hybrid methodology is adopted to aid the software development process and continuous integration adopted to validate and test whether requirements have been met.
Business Challenge Context
1.1.1 Business
The British Broadcasting Corporation (BBC) is a Public Service Broadcaster (PSB) (BBC, 2025). The Corporate Digital and Applications (CDA) department (Appendix Z) is responsible for maintaining the internal intranet and web-applications which provide staff with tools to enhance their everyday work. (Pitt, 2020). These tools are hosted in the cloud on Amazon Web Services (AWS) and organised in a monorepo.
1.1.2 Organisational context of proposed challenge
PSBs like the BBC or France’s TV5 are under constant threat of cyber-attack (Corera, 2016). To prevent this, companies need to be vigilant and ensure systems and controls are in place (Appendix Z). The BBC Cyber-Security Vision is to “adopt suitable processes and controls to protect itself, employees, audience and suppliers, as far as practical from cyber-attack” (Appendix Y). They have set goals to achieve this vision including “Our cyber-security defences operate consistently across all business areas of the BBC”, and “Our employees recognise the information security” (Appendix AA). These goals highlight the importance of employee vigilance which Moore (2025) suggests is a major type of cyber-security threat, especially social engineering.
At the BBC, the Information Security Department (InfoSec) ensure staff have an appropriate level of cyber-security awareness to mitigate the risk of a security breach. To monitor the human cyber-security risk within the organisation, InfoSec are looking for a system to analyse trends and collate insights on employee’s knowledge of security. This data will be collected through surveys throughout the year. By collating this information, the InfoSec Awareness team can target training material, so staff are equipped and “cyber-security defences operate consistently across all business areas”. This system helps meet the BBC’s cyber-security goals.
Artefact Design & Development
1.2 Solution platform
The system will be a web-based solution, comprising of a React frontend with Node Lambdas. Data will be stored in a MySQL database.
React was chosen as the frontend solution due to its popularity (State of JS, 2024). The popularity of the framework means many plugins are available (Ibrahim, 2023) and collaboration, such as code reviews, can take place. React provides a component-based architecture that allows the application to be broken down into smaller, simple components. This is a benefit as it makes the application scalable and easier to maintain (Ibrahim, 2023). Although many JavaScript frameworks share these qualities (Martin, 2025) such as Angular, React was chosen due to its performance advantages (Suthar, 2024). One being that it utilises a virtual DOM rather than Angular’s approach of modifying the actual DOM with every update which can be resource intensive (Katariya, 2023). Due to being an internal application, React’s limited SEO options are of little consequence.
The backend is a serverless solution using AWS Lambdas. This has been chosen as the BBC has announced plans to become leaner and more agile (O’Kane, 2024). One benefit of using Lambdas is resources can be freed up and code can be run without the need to manage server infrastructure (Vasudev, 2023). This allows more resources to be focused on innovation and improving product value. It also means the BBC can meet its goal of becoming leaner as the need for specialised engineers to provision servers is now redundant.
Despite this project not having a dedicated budget, cost-effectiveness for licence-fee payers is a concern (BBC Press Office, 2022). By leveraging AWS, the BBC minimises infrastructure costs as the serverless nature only utilises resources when necessary (Rehemägi, 2021). Furthermore, open-source tools such as React avoids licensing costs, making the project cheap and a good return-on-investment.
1.1 Requirements and factors that affect them
Appendix A shows the requirements document provided by the Infosec business analyst. These were broad, with open statements about data analysis. The National Audit Office (2012) highlights the difficulties in specifying all the requirements for software, as needs often change. These changes pose a risk to the success of systems and are a main factor in the unsuccessful delivery of stakeholder requirements (Jayatilleke and Lai, 2017). Inayet et al. (2015) recognises the importance of stakeholder involvement, stating that it is the “primary reason for project success”, with frequent communication proving invaluable for the evolution of requirements. CDA management (Appendix C) agree, stating that it is essential to spend time working out requirements at the beginning of a project. This aligns with two BBC values “we are one BBC and should collaborate, learn and grow together”, and also that “audiences are at the heart of everything we do” (BBC, 2024). To develop and refine these requirements prototyping was undertaken (Aschenbrenner, 2024).
Prototyping improves stakeholder clarity through early user participation to develop and refine requirements (Bødker and Grønbæk, 1991; Scacchi, 2001; Inayet et al., 2015; Doyle and Pope, 2016). Using a prototype reduces rework, leads to fewer changes in subsequent iterations and simplifies implementation (Scacchi, 2001; Inayet et al., 2015; Jayatilleke and Lai, 2017). Doyle and Pope (2016) disregard prototyping, arguing it is a waste building software that may not be useful; The National Audit Office (2012) shares that sentiment saying prototypes should be in the form of low-fidelity wireframes. However, they fail to consider that prototyping is fast (Hammond and Phillips, 2023), where issues such as reliability and performance are temporarily ignored (Sommerville, 2019). Working with open source and component libraries means we can leverage existing solutions for speed (Downey, 2014).
The Global Experience Language (GEL) is the BBC's component library (Bailey, 2016). Prototypes reduces misunderstanding and better demonstrate how a service works than wireframes (Downey, 2014; Doyle and Pope, 2016).They are also faster, eliminating the need for multiple mock-ups (Clarke, 2009). Prototyping supports the CDA value of reducing delivery time so users get immediate value (Appendix D). This challenges Inayet et al’s. (2015) contention that the development of high-fidelity prototypes is expensive.
Initial requirements are open to interpretation, therefore Joint Application Development (JAD) was used to allow developers across CDA to collaborate on prototypes based on their interpretation of the requirements (Wood and Silver 1995). Scacchi (2001) explains developer collaboration yields the best solutions due to technical insight. Two prototypes with different approaches provide a way to review the requirements (Jayatilleke and Lai, 2017). This allowed an evolutionary prototype, a working system evolved from feedback of the best parts of both prototypes, before moving onto subsequent iterations (Scacchi, 2001; De Lucia and Qusef, 2010; Sami, 2012).
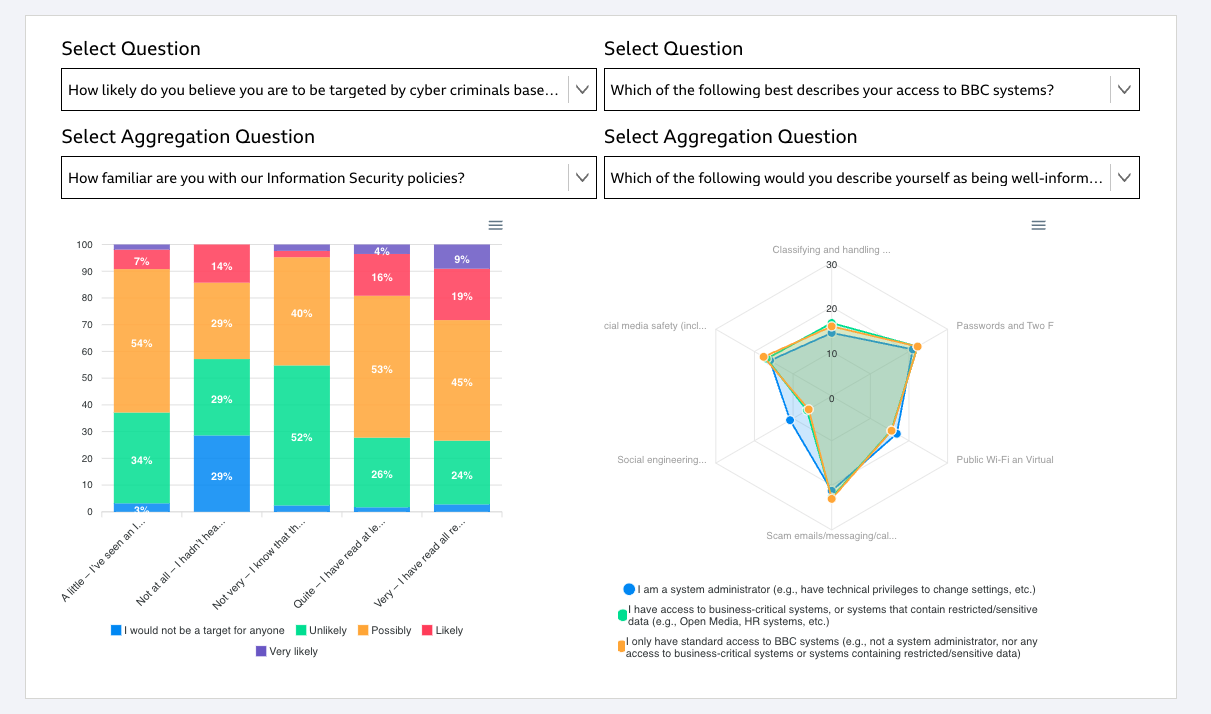
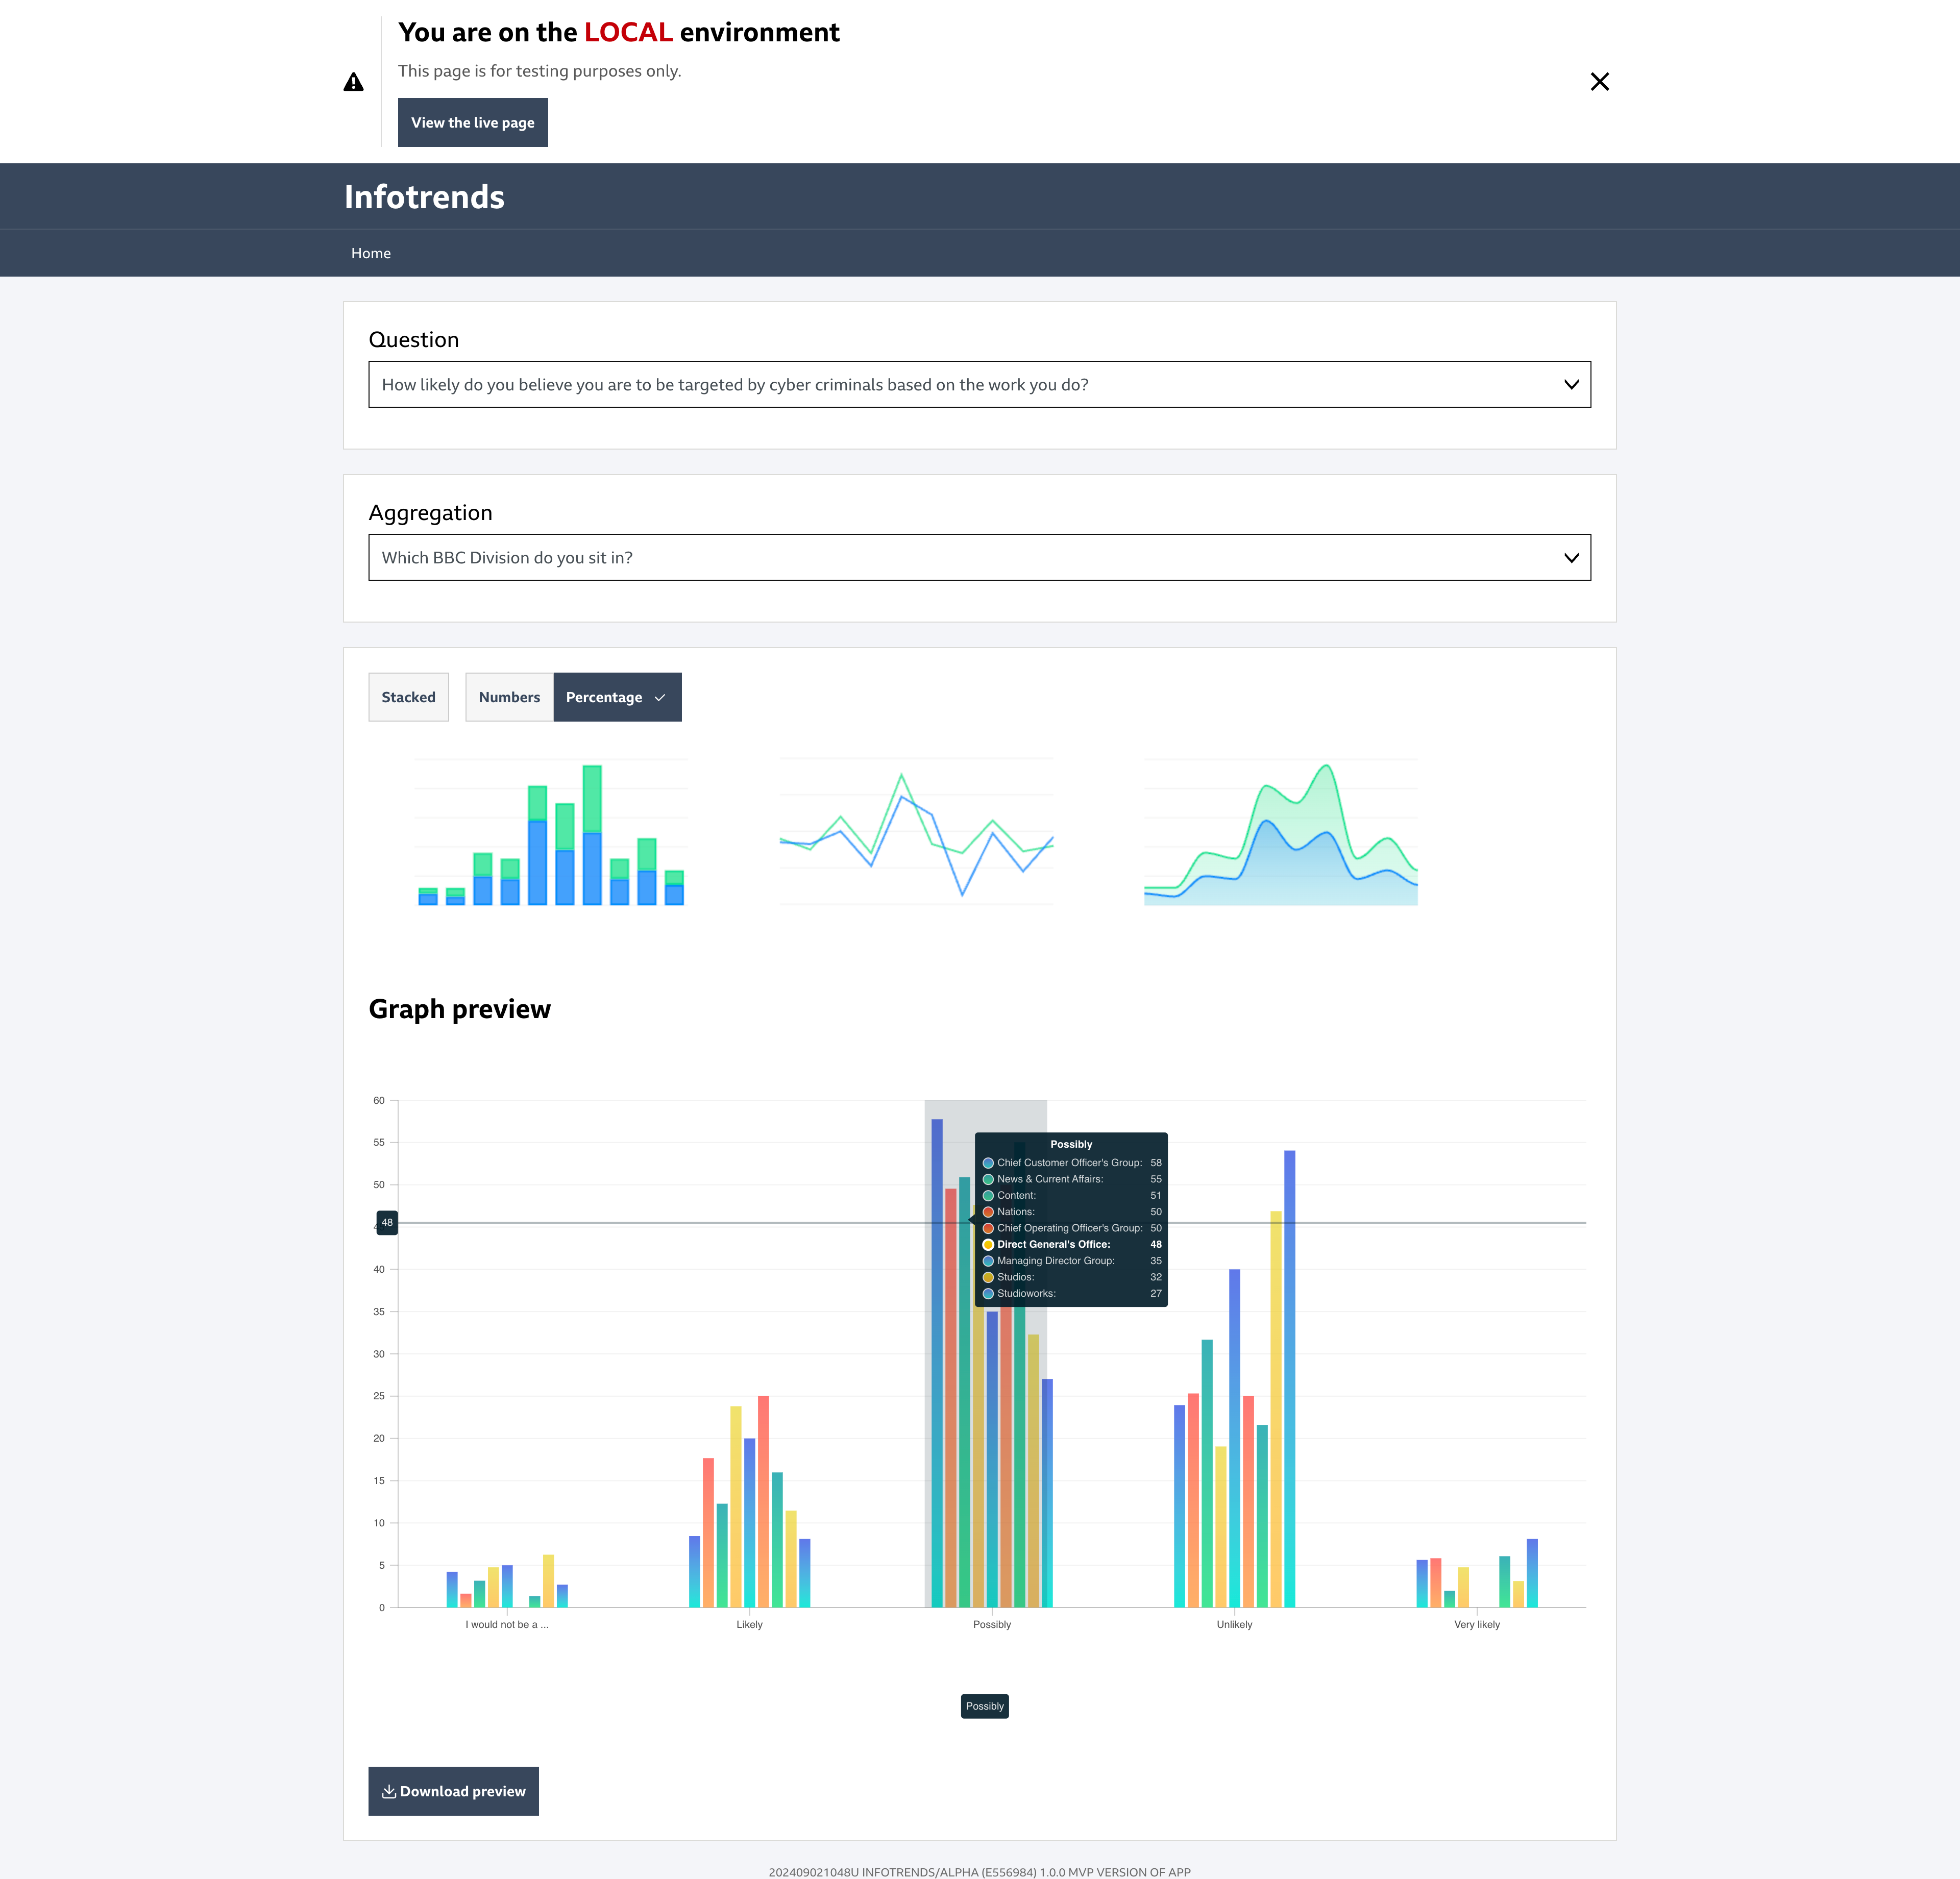
The two prototypes produced are shown in Figures 1-2.
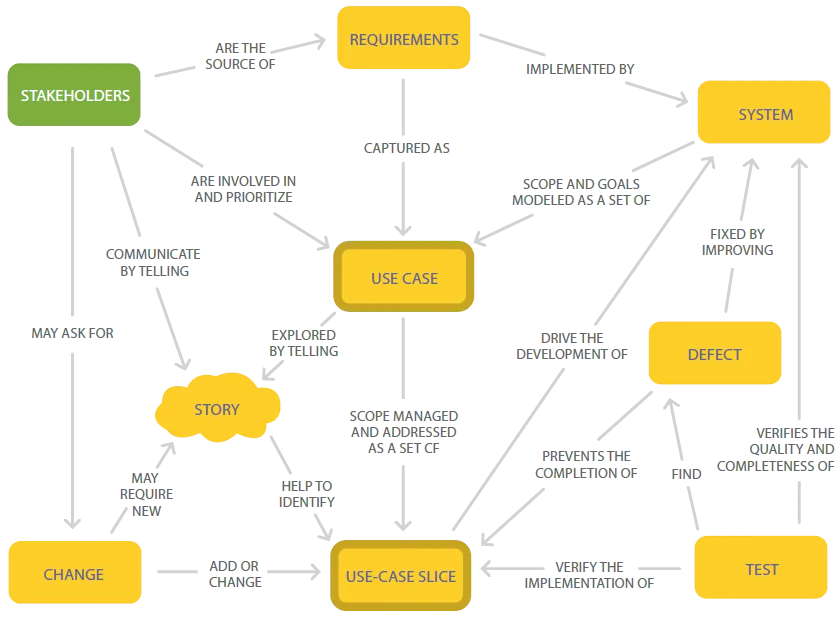
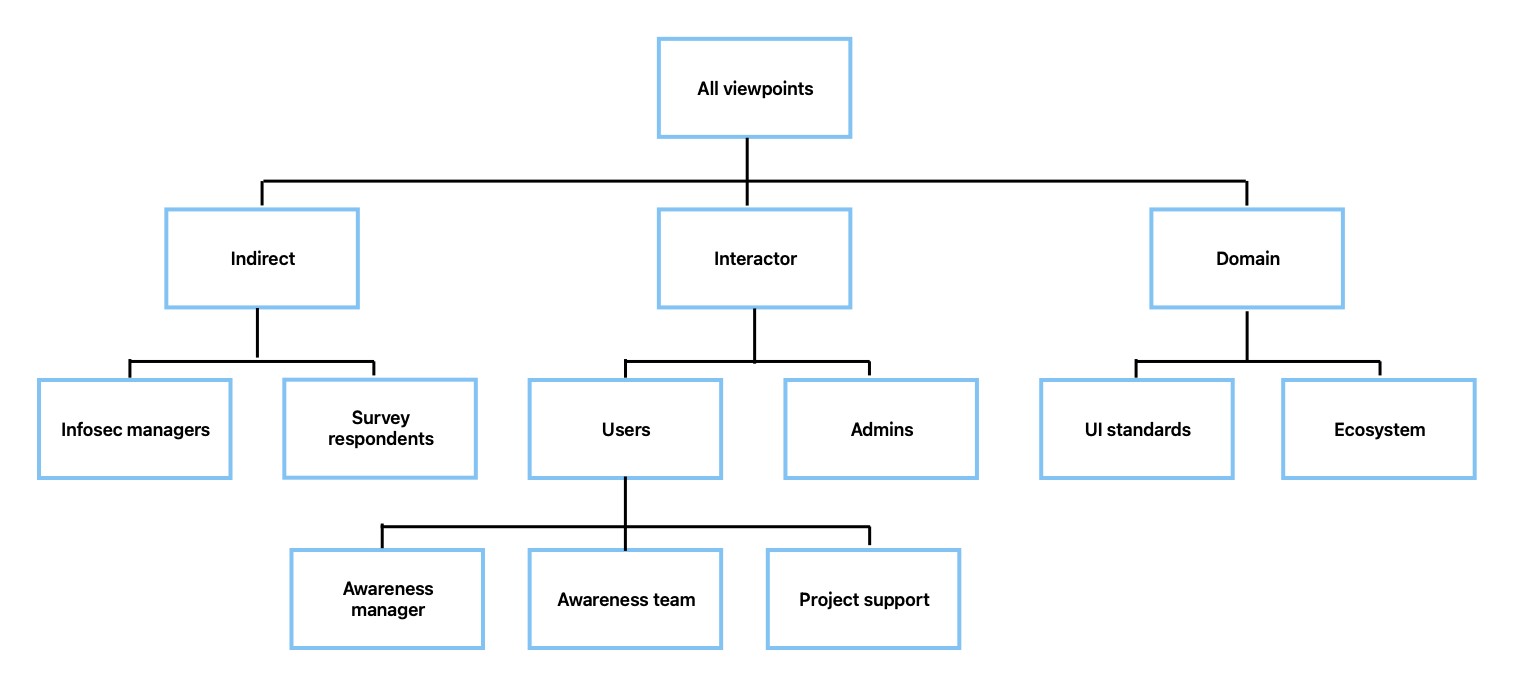
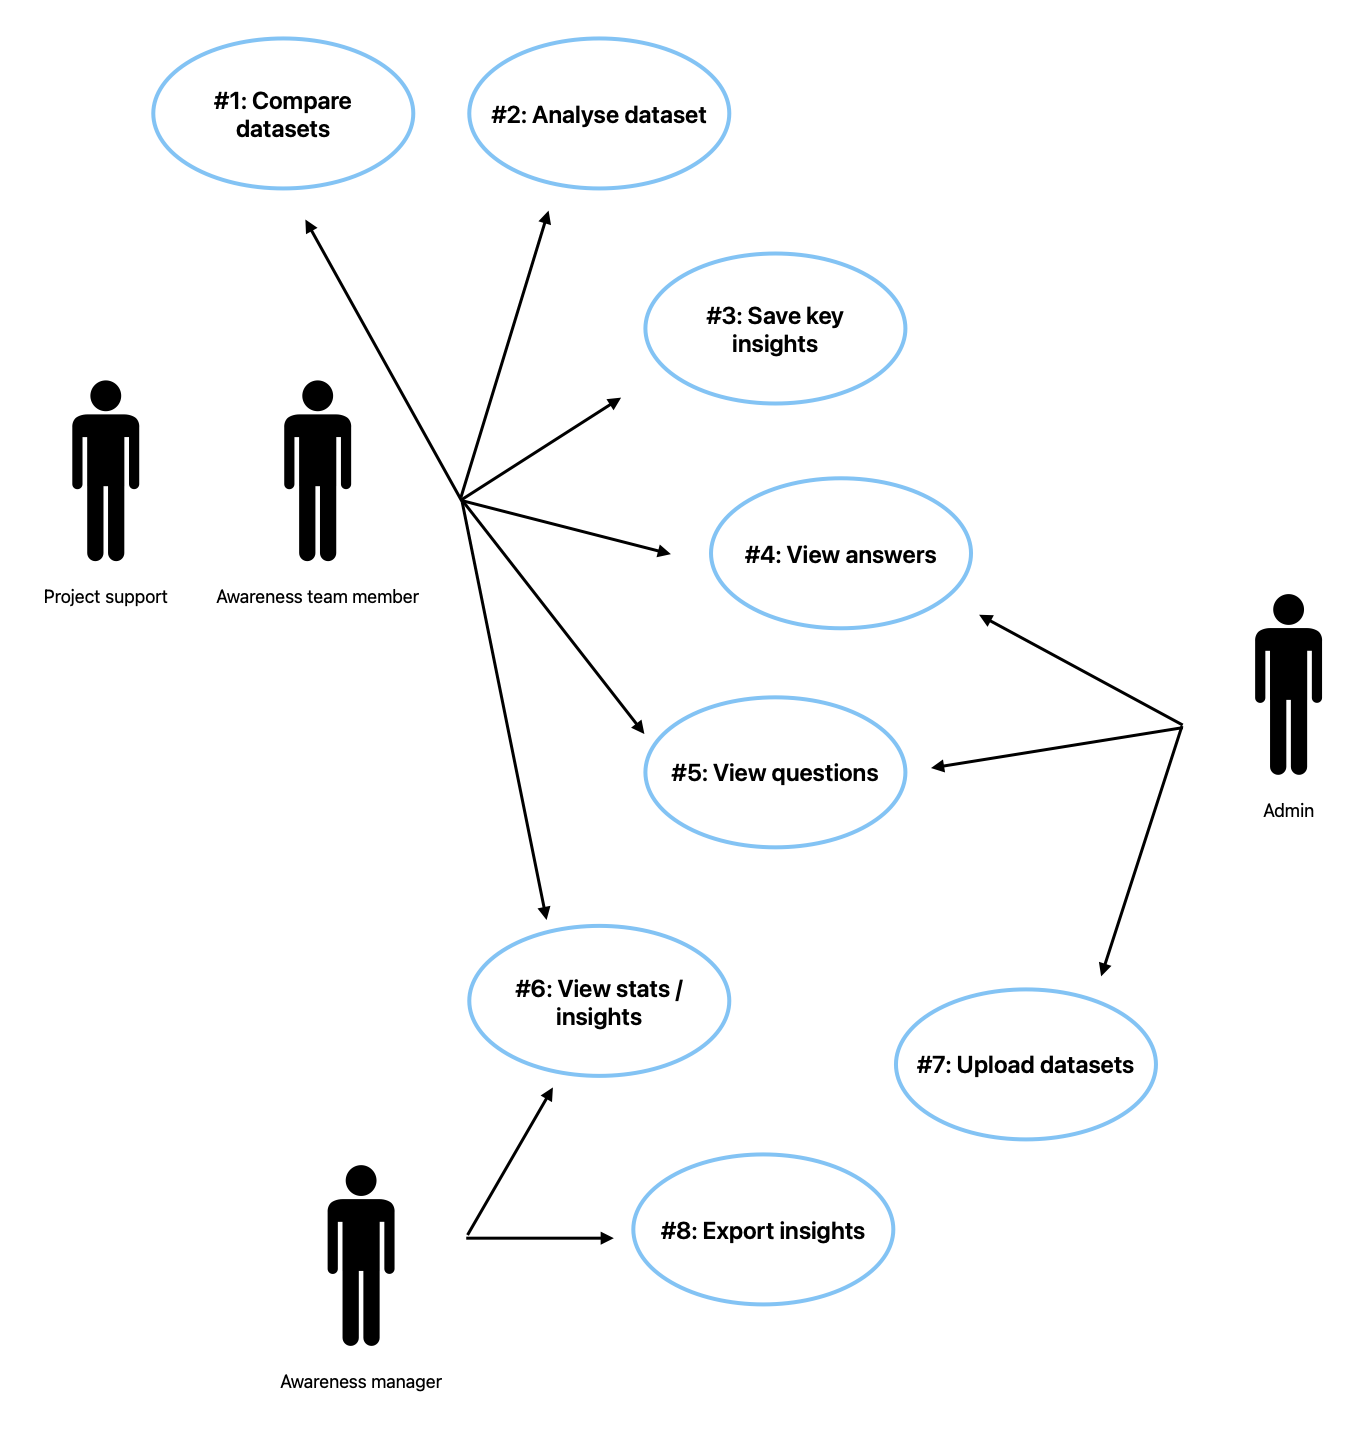
To capture, organise and link requirements the Use-Case 2.0 model, shown in Figure 3, was used (Jacobson and Spence, 2024). It provides a transition from stakeholders, use-cases to scenarios and all the way to tests (Jacobson and Cockburn, 2023). In the beginning, all relevant stakeholders are identified (De Lucia and Qusef, 2010) and worked with to discuss scenarios which drive the implementation of the system (Jacobson, Spence and Kerr, 2016), see Figure 4 for a viewpoint diagram outlining stakeholders. Mietzner and Reger (2005) argue producing scenarios is time consuming, as use-cases can produce an infinite number of scenarios (Firesmith, 2004). This goes against the CDA value to “provide value at pace” (Appendix E) and neglects another value “providing what people need” (Appendix F). If sufficient time was not spent on scenarios there would be a lack of knowledge surrounding the requirements (Government Digital Service, 2012). Firesmith (2004) advises to limit analysis to the most important scenarios and elements “that make a difference first” (Appendix G).
Viewpoints help identify the people who can provide information about their requirements and structure the requirements for analysis (Summerville, 2015).
1.3.1 Use cases
A use-case is a description of the interactions between a system and users, it scopes and illustrates the ways to use the system and shows the value it will provide (Cockburn, 2000; Sommerville, 2015; Jacobson and Spence, 2024).
In Figure 5 you can see the critical use-cases for the system (Smith et al., 2021).
1.3.2 Scenarios
To understand use-cases, scenarios are told, these cover how to navigate a use-case and how to handle problems that occur (Jacobson and Spence, 2024). A benefit of using scenarios is that it encourages developers to look at the whole picture before developing solutions (Alexander and Maiden, 2004; Design Community, 2019). The most important scenarios were mapped out (Design Community, 2019) in Tables 1-2, the rest can be found in Appendix FF.
|
#1 Compare multiple datasets |
|
Primary actor: Awareness team member / project support |
|
Main scenario: 1. An awareness team member goes to the analysis page and wants to see if there has been an improvement to staff understanding of security policies 2. The system loads in all the available datasets to select from 3. The system loads in all the available questions to select from 4. The awareness team member selects the question about understanding of security policies 5. The awareness team member selects which datasets they want to compare the results of the question against 6. If they wish to the awareness team member can filter results by a job title or division 7. The awareness team member can choose whether they want results returned as total responses or as percentages 8. The awareness team member selects what sort of chart they want the results returned in 9. The system displays that information in the chosen configuration 10. Once happy they can choose to save the configured chart to the dashboard |
|
Alternatives: 6a. The awareness team want to filter or aggregate data by "System administrators" 6b. They want to filter data by job roles they know are at high-risk. These are people with roles that are typically considered system administrators. However, people fulfilling these roles don't all have the title of system administrator, they are groups of people across different job titles. |
|
#2 Analyse single dataset |
|
Primary actor: Awareness team member / project support |
|
Main scenario: 1. An awareness team member goes to the analysis page and wants to see which divisions feel like they are likely to be targeted by cyber criminals and should be prioritised for awareness support. 2. The system loads in all the available datasets to select from 3. The system loads in all the available questions to select from 4. The awareness team member selects the question about how likely people are to be targeted by cyber criminals 5. The awareness team member selects an aggregation question, in this case, a question asking which division the respondent sits in, to group the results by 6. If they wish to the awareness team member can filter results 7. The awareness team member can choose whether they want results returned as total responses or as percentages 8. The awareness team member selects what sort of chart they want the results returned in 9. If they are happy the awareness team member can choose to save the configured chart to the dashboard |
|
Alternatives: 5a. As well as seeing results for which divisions or job titles need to be targeted for support the awareness team want to see which job bands need to be targeted for support 5b. When filtering or aggregating data the user should be able to choose a job band to group / filter the data by. 6a. As well as seeing results for which divisions or job titles need to be targeted for support the awareness team want to see which buildings should be targeted for support. 6b. The awareness team want to be able to filter or aggregate results by building 8a. After making a chart the awareness team want a “split view”. The ability to configure another chart next to the one they have just made to compare. |
A workshop with the stakeholder took place, by using the prototypes we were able to discuss the steps described in the scenarios. This allowed for alternative provisions and fixes when issues were identified (Kyng, 1995).
1.3.3 User requirements
The user requirements have been classified using Clegg and Barker’s (1994) MoSCoW rating. This organises the requirements into categories of what “Must”, “Should” and “Could” be delivered, allowing work to be prioritised (Product and service community, 2018; Zacarias, 2022).
|
1) The system must be able to import datasets every 6 months (non-functional) 2) The system must be able to make comparisons of results for different datasets over time 3) The system must be able to aggregate, filter and analyse results based on survey questions: a) How long have you worked for the BBC? b) Which of the following best describes your access to BBC systems? c) Which BBC Division do you sit in? 4) The system must maintain security of the data (non-functional) 5) Names and employee numbers must be anonymised in the analysis (non-functional) 6) The system must only be accessible to those granted rights and sit behind a login (non-functional) 7) The system must be accessed throughout the year on an ad hoc basis to monitor progress, and spot trends, as well as in situations when reacting to certain security risks or incidents. (Non-functional) 8) System should aggregate, filter and analyse results from HR staff SAP datapoints: a) Org unit name b) Department c) Job title 9) System should generate visual interpretation of analysis 10) System should generate visual analysis showing changes over time 11) System should export these visualisations for use in other documents away from the tool 12) System should display core metrics in a dashboard / provide ability to save default filters so they are easily revisited 13) System could provide confidence indicators based on total individuals in org unit / division 14) System could aggregate, filter, and analyse results based on InfoSec data sources 15) System could generate multiple styles of chart / graph |
1.3.4 System requirements
The Volere requirements template was used to provide a structure for referencing the use-case each requirement came from (Alexander and Maiden, 2004). The template aids requirements traceability to identify a requirement from origin through use-cases, scenarios, design logic, to source code and acceptance tests. Traceability is crucial when requirements change often (De Lucia and Qusef, 2010).
|
ID |
Requirement type |
Event/use-case ID |
Description |
Rationale |
Fit criterion |
Customer Satisfaction |
Customer Dissatisfaction |
|
1.1 |
Non-functional |
#7 |
Every 6 months the awareness team will export survey data from an external system in the form of an Excel spreadsheet. |
This is how often data is exported from the external survey system. |
Multiple datasets can be imported into the system |
5 |
5 |
|
1.2 |
Functional |
#7 |
The system shall decode the spreadsheet to JSON to be ingested by the API. |
The import endpoint accepts data in the JSON format. |
Convert the Excel spreadsheet into JSON for import |
1 |
1 |
|
2.1 |
Functional |
#1 |
Each dataset will be recorded as a new entry in the database with the date of the import. |
Datasets need to be linked to a period when analysing. |
For each dataset there must be a corresponding time |
2 |
5 |
|
2.2 |
Functional |
#1 |
The system shall allow datasets to be selected with a question to generate a visualisation and comparison of the answers for the selected question between the selected datasets. |
To be able to compare datasets. |
Numerous datasets should be able to be selected and compared against an aggregation. The output should be a chart displaying all data |
5 |
5 |
|
2.3 |
Functional |
#1 |
When doing an analysis, the application should display a dropdown of all imported datasets to select from to compare. |
To be able to make comparisons over time. |
The ability to select all imported datasets when analysing |
2 |
5 |
|
2.4 |
Functional |
#2 |
When doing an analysis, the application should display a dropdown of all questions to select from to compare against. |
To be able to analyse the answers to questions. |
The system should display all questions in the system to select from. |
2 |
5 |
|
3.1 |
Functional |
#7 |
On import of a dataset the system will record unique questions and answers. Any additional questions or answers in subsequent datasets will also be recorded. |
If additional questions and / or answers are added to the survey the system should be able to accommodate this. |
Additional questions or answers in later datasets are added to the system |
1 |
5 |
|
3.2 |
Functional |
#1, #2 |
After making an analysis the system should allow you to further filter results down by answers to other questions. |
This will allow the awareness teams to target groups of people based on certain traits. |
Be able to filter results by answers to questions |
5 |
2 |
|
5.1 |
Functional |
#1, #2 |
Names and staff numbers will not be available through the application or API. |
Privacy. To keep anonymity and so people aren’t targeted. |
Names and staff numbers will be hidden throughout the application. |
2 |
2 |
|
6.1 |
Functional |
|
Access to the system will be restricted to authorised users in a role-based system at the UI application layer and GraphQL layer. |
The application holds very sensitive data that shows the vulnerable areas of the business. Only authorised users can access it. |
Only users linked to a policy granting access to the application will be able to visit the app and make queries or mutations. |
2 |
5 |
|
8.1 |
Functional |
#1, #2, #6 |
Employee staff numbers will be used to cross-reference individual survey results to HR SAP data for staff. |
SAP holds rich data that is unavailable through the survey which will help the awareness team target marketing campaigns. |
Employee staff numbers will be used to cross-reference individual survey results to HR SAP. |
5 |
3 |
|
8.2 |
Functional |
#1, #2 |
After making an analysis the system should allow you to filter results down by job title. |
The awareness team want to be able to see the responses or at-risk job roles. |
Be able to filter by job title. |
5 |
2 |
|
8.3 |
Functional |
#1, #2 |
After making an analysis the system should allow you to filter results down by department. |
The awareness team can see which departments have the best security knowledge. |
Be able to filter by department. |
5 |
2 |
|
8.4 |
Functional |
#1, #2 |
After making an analysis the system should allow you to filter results down by division. |
The awareness team can see which divisions have the best security knowledge. |
Be able to filter by division. |
5 |
2 |
|
8.5 |
Functional |
#1, #2 |
After making an analysis the system should allow you to filter results down by employee type. |
The awareness team can see if freelancers or permanent staff need to be targeted. |
Be able to filter by employee type. |
5 |
2 |
|
8.6 |
Functional |
#1, #2 |
After making an analysis the system should allow you to filter results down by building. |
The awareness team can point efforts to particular buildings around the country. |
Be able to filter by building. |
5 |
1 |
|
9.1 |
Functional |
#1, #2, #8 |
The system shall generate visual analysis based on inputs in the form of select graphs and charts. Such as bar charts, line charts and area graphs etc. |
An easy way to view data to spot trends. |
Output results in the form of bar charts, line charts, area graphs and pie charts |
4 |
5 |
|
11.1 |
Functional |
#8 |
The system shall allow the user to export the visualisations they have generated as a PNG. |
So visuals can be used in presentations etc. |
|
2 |
2 |
|
12.1 |
Functional |
#6 |
The dashboard of the system shall display core metrics such as total number of responses, total number of participants, questions and answers. |
To give an overview to the awareness team about the robustness of the data they are looking at. |
The dashboard should provide an overview of how much data is in the system |
2 |
2 |
|
12.2 |
Functional |
#3 |
After configuring a visualisation with selected datasets, questions and potentially filters the system will allow users to save configured visualisations to the dashboard |
Allowing detailed configurations to be saved means different members of the team can easily access them and return to spot trends when new datasets added. |
Queries can be saved to the dashboard for easy access |
5 |
3 |
|
12.3 |
Functional |
#3 |
Configurations for an analysis will be written to the URL as parameters |
This is so configurations are easily able to be shared amongst team members. |
When making a configuration the settings will be written to the URL as parameters |
3 |
1 |
|
13.1 |
Functional |
#5 |
The system should display a table of all the questions in the system. |
This is so the user can see an overview of the questions in the system. |
Display all questions on a questions page |
3 |
3 |
|
13.2 |
Functional |
#5 |
The list of questions should be paginated and link to a question detail page |
The number of questions may grow so we don’t want to be asking for hundreds of questions if it were to grow to that amount |
Paginated question table |
3 |
3 |
|
13.3 |
Functional |
#5 |
The question detail page should show specific insights about the selected question. Such as mean, median and mode of answers / types of people that answered |
To provide an easy way to view question specific insights |
A question detail page showing specific insights |
5 |
2 |
|
14.1 |
Functional |
#4 |
The system should display a table of all the answers in the system. |
This is so the user can see an overview of the answers in the system. |
Display all answers on a answers page |
3 |
3 |
|
14.2 |
Functional |
#4 |
The list of answers should be paginated and link to a answer detail page |
The number of answers may grow so we don’t want to be asking for hundreds of answers if it were to grow to that amount |
Paginated answer table |
3 |
3 |
|
14.3 |
Functional |
#4 |
The answer detail page should show specific insights about the selected answer. Such as mean, median and mode of types of people that answered |
To provide an easy way to view answer specific insights |
An answer detail page showing specific insights |
5 |
2 |
1.3.5 Systems design
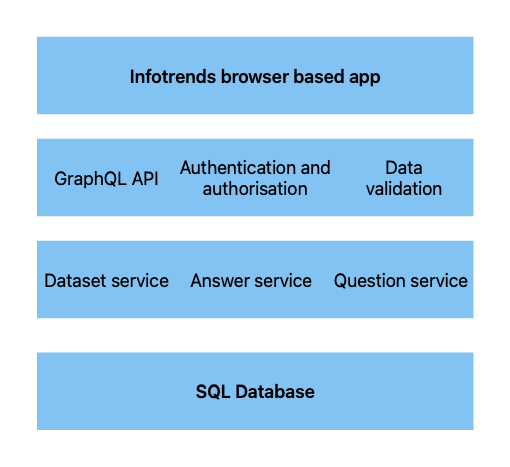
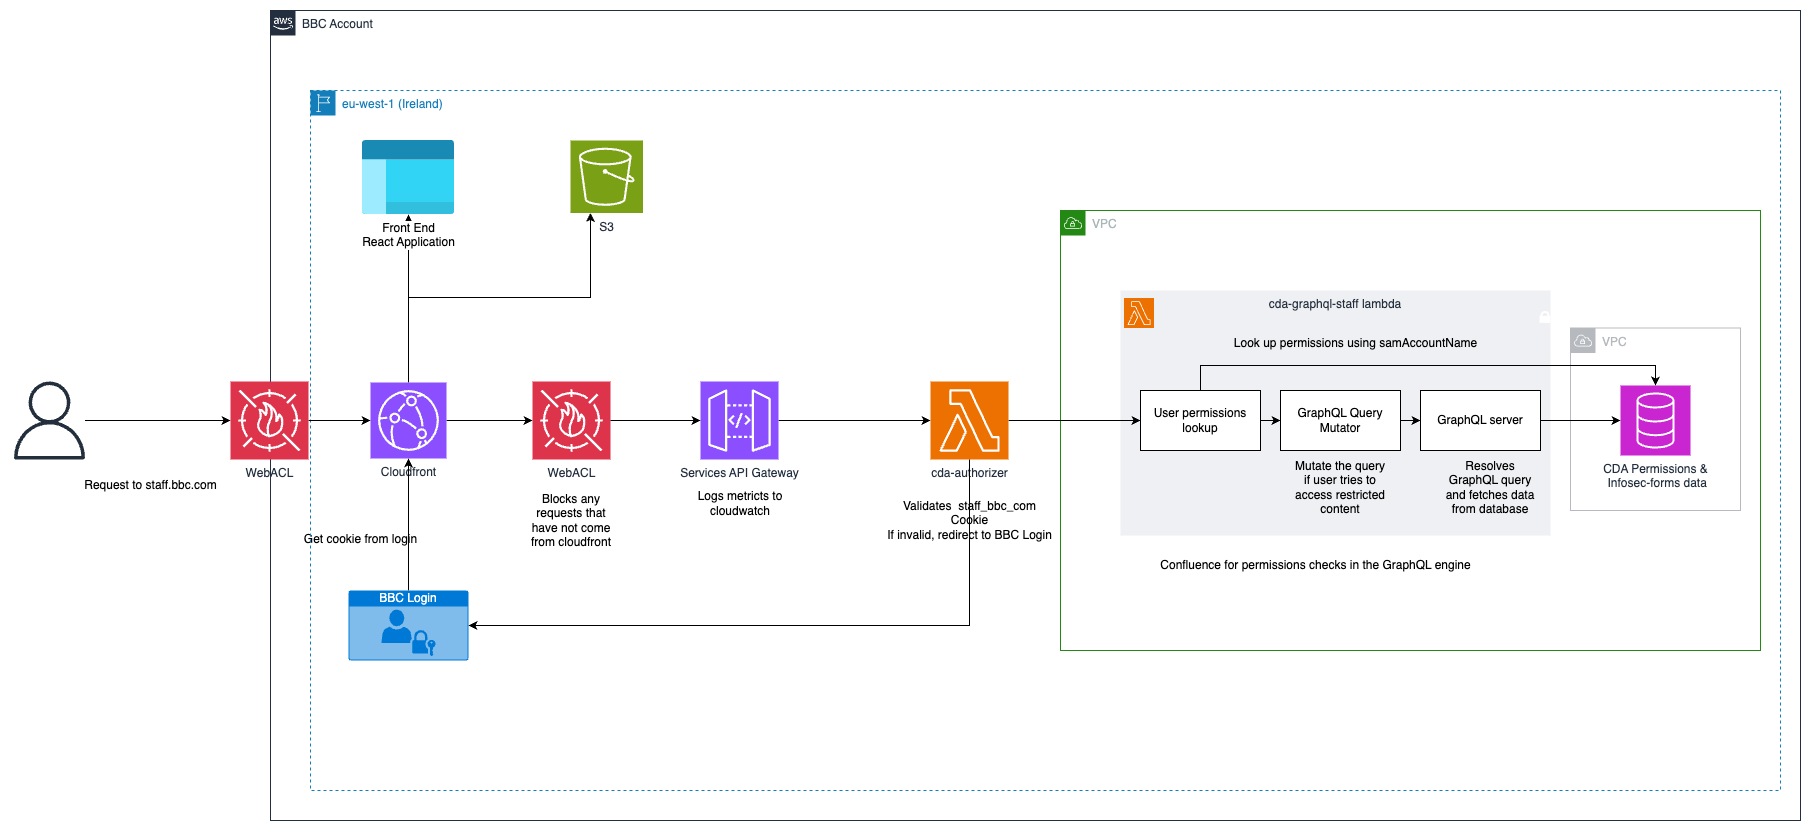
System architecture has a close relationship with fulfilling non-functional requirements (Sommerville, 2015). A critical one being to uphold the security of data and to ensure the system is only accessible to those granted rights. To support the security constraint, a layered approach was used (Figure 6). The critical part of the system is the survey data stored in the SQL database; by using the layered approach it can be protected within the innermost layer below security layers which enforce authentication, authorization and data-validation (Bosch, 1999). Due to the data being held, a client-server architecture would pose security risks as the servers are an attractive target for attacks (Pandey, 2024) and the data highlights the BBC’s areas of weakness which could lead to targeting. In Figure 7 you can see how the approach was paired with a serverless architecture.
Another non-functional requirement was that it must be able to import new datasets every 6 months. With ~22,000 staff (BBC, 2021) a large amount of data will be imported. Although there is considerable data being imported, the system will only be accessed occasionally by 6 users. This made a layered architecture appropriate as it encourages modular development with clear divisions between layers. This allows both requirements to be met as each layer, including the database, can be scaled independently to accommodate different needs (Ali, 2024).
As the system will be accessed on an ad-hoc basis, the services will be stored in lambdas and application in s3 (see Figure 7) allowing a cost-effective pay-as-you-go pricing scheme (Rehemägi, 2021). An alternative approach is a monolithic architecture, a tightly coupled, single codebase system that allows for rapid development and perceived simplicity. However, was not chosen due to limited scalability which involves high costs and over-provisioning due to its tight integration (Gupta, 2024). Developers would be forced to scale even the presentation layer to provision the database. The layered architecture allows the BBC to progress towards its goal of reducing costs (BBC Press Office, 2022) and achieving the non-functional requirements.
1.4 Methodology
BBC’s Director General stated in a plan to be digital-first “we need to evolve faster and embrace the huge shifts in the market around us” (BBC Press Office, 2022), and the CTO O’Kane (2024) adding these aims can be met by becoming leaner and more agile.
The waterfall methodology is rigid with a strict path the project must follow, with no notions of concept exploration, building prototypes or iteration, it does not allow for system upgrades, feedback from users or improvements (Alexander and Maiden, 2004). The lack of iteration and feedback make it impossible to “embrace the huge shifts in the market” (BBC Press Office, 2022). The model assumes perfect unchanging information surrounding the requirements, solutions, and end goal (Lei et al., 2015). As systems using waterfall are released all at once at the end of the lifecycle (Sami, 2018) it does not align with how CDA want to operate (Appendix M) who say to release frequently so stakeholders can get immediate value. The sentiment is shared with The National Audit Office (2012) that state releasing a system at once is destined to fail. For these reasons, plus the vague requirements explored in the above section, it would seem the waterfall method is not adequate for this project. However, while the method insists on perfect requirements, Stoica, Mircea and Ghilic-Micu (2013) state the requirements elicitation stage at the start of waterfall is the most important as it reduces the risk of failure by ensuring the system meets the needs of users and delivers value (Tornqvist, 2023).
Agile was introduced in response to the slow, inflexible, approaches of the waterfall methodology (Lei et al., 2015). Middleton and Joyce (2011) describe how projects undertaken using waterfall were frequently unsuccessful. Research undertaken by The Standish Group (2020, cited in Talreja, 2023) shows agile projects have twice the likelihood of success and less than half the chance of failure compared to waterfall projects. However, the study’s scope for what is considered a “success” is narrow and failed to consider quality and value-to-customer amongst the criteria of time, scope and budget (Cohn, 2023). Despite this pitfall, agile improves the likelihood of success due to breaking the project down into iterations and emphasising collaboration through continuous integration and evaluation (Petersen and Wohlin, 2009; Atlassian, 2024). These values that agile uphold align with how CDA management recommend developing software (Appendix L) and allow the BBC to meet its goal of “embracing huge shifts in the market” (BBC Press Office, 2022). Stoica, Mircea and Ghilic-Micu (2013) state achieving continuous integration requires agile tools despite The Agile Manifesto stating “individuals and interaction over processes and tools” (Beedle et al., 2001). Staff in CDA are located across the country meaning tools such as Jira (Appendix O) are crucial to manage interactions (Middleton and Joyce, 2011; National Audit Office, 2012). While we can see the advantages that agile provides following them by the book would be an issue.
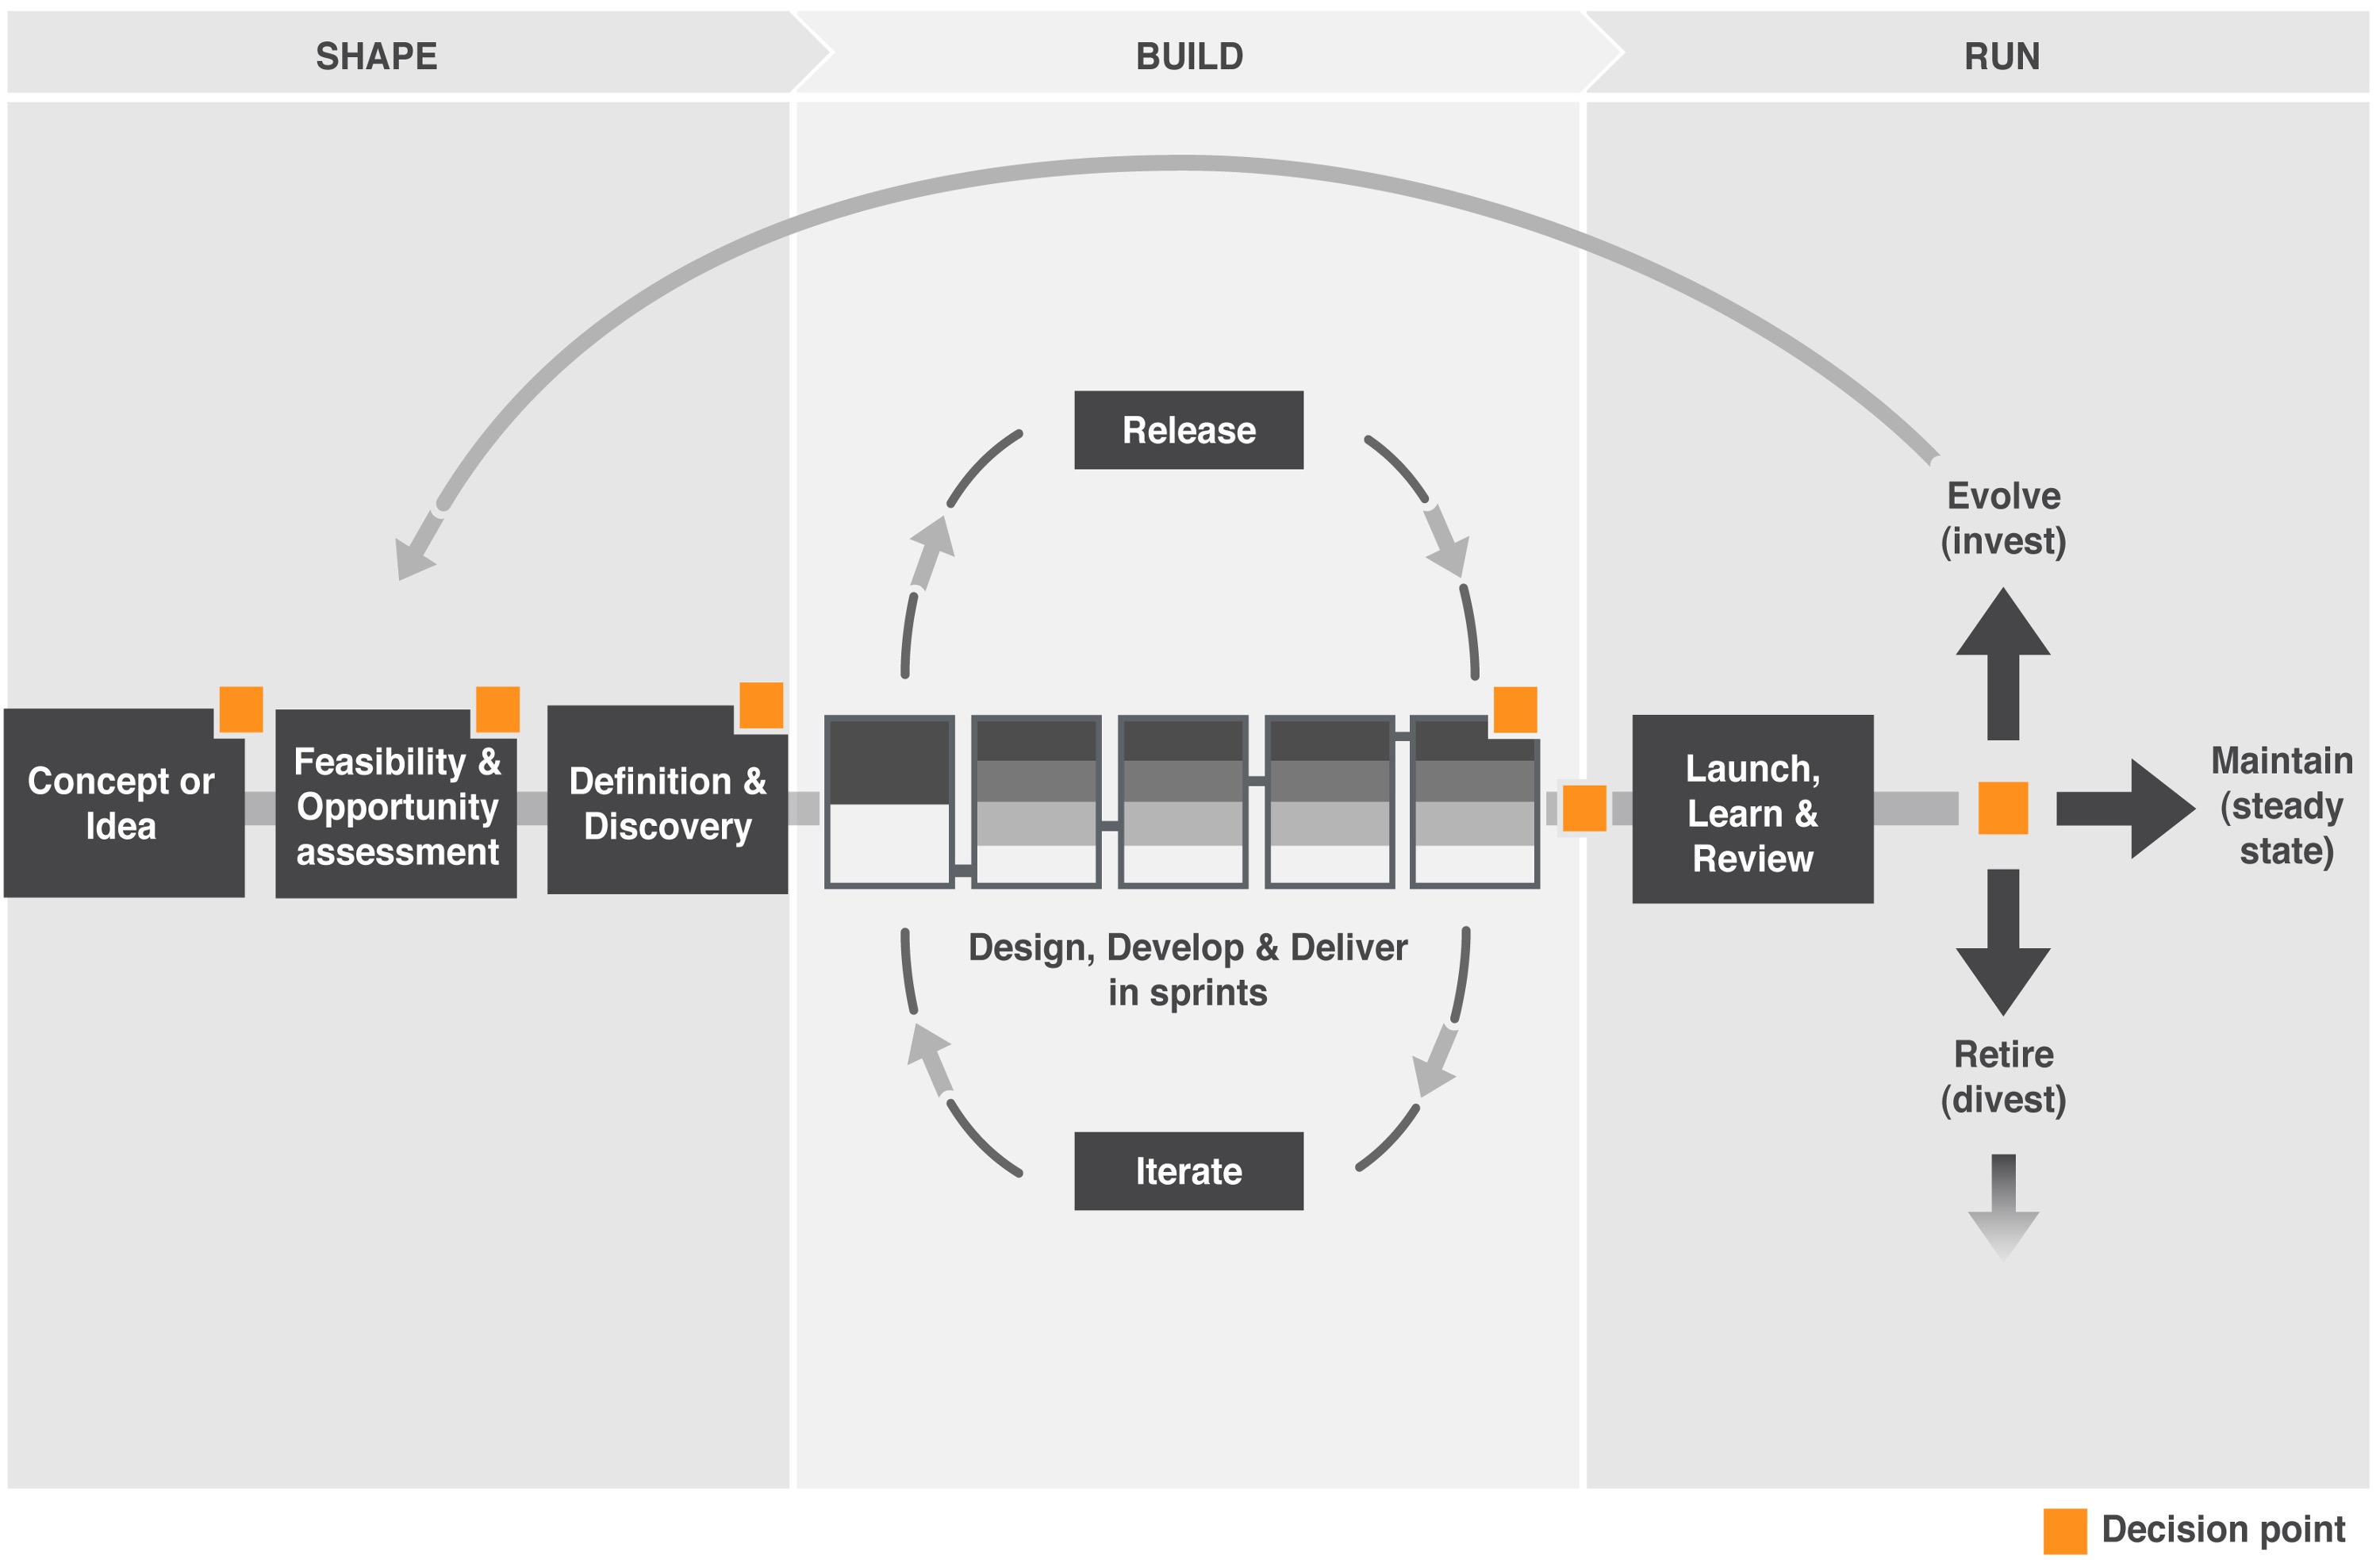
A hybrid software-process is a combination of approaches adapted to the needs of the organisation (Kuhrmann, et al., 2019). Pressure to release high quality systems at a faster rate is forcing practises to be adapted (Murphy et al., 2013). Figure 8 shows the ‘shape–build–run’ hybrid model presented by Nic Newman. This hybrid model was used for this project because it allows lean ideas through a blend of agile and waterfall (De Lucia and Qusef, 2010; Kuhrmann, et al., 2019). The requirement elicitation step from the waterfall method was used in the ‘shape’ stage to guide the project in the right direction, as explored above. This is despite De Lucia and Qusef (2010) arguing requirements changing and stakeholder inability to state needs make it not useful as agile practices in the ‘build’ stage, such as building up the system in increments, will respond to changes (National Audit Office, 2012). Plus, agile methods such as prototyping can be used to aid the elicitation stage by not working on misunderstood or incorrect requirements, making the hybrid model lean by minimising waste (Middleton and Joyce, 2011) and achieving the CTO’s goal.
1.4.1 Risk management
Risk management involves anticipating risks that might affect the project and taking action to avoid them (Hall 1998). Types of risks and how they will be mitigated can be seen in Table 5.
|
Risk |
Description |
Affects |
Risk type |
Probability |
Impact |
Mitigation strategy |
|
AWS Costs |
Potential to incur varied AWS costs. |
Business |
Tools |
Low |
Low |
Architect project with cost effective AWS services. |
|
Lack of Stakeholder engagement |
Slow cooperation may make requirement elicitation and feedback difficult. |
Product |
Requirements |
Medium |
Medium |
Regular communication and demonstrations of the product to engage stakeholders and elicit feedback. |
|
Changes to requirements |
Stakeholders may suggest new ideas, new features or changes. |
Project, product |
Requirements |
Low |
Low |
Outline the product boundaries, what the product is and what it is not. Allow additions to the backlog but not sprints in duration. |
|
CDA shared infrastructure. |
The shared infrastructure and code used across the CDA suite of apps. Changes made could impact application |
Project, product |
Tools |
Medium |
Medium |
PRs will be shared with the wider team for code reviews so there is visibility into how the application works across everyone. |
|
API performance |
Slow API performance makes app unusable |
Product |
Technology |
Low |
High |
Ensure design is built to scale and efficient |
|
Database performance |
Large amounts of data will be stored in the database. Efficient queries will have to be written in to effectively retrieve desired data. |
Product |
Technology |
Low |
High |
Integration tests to ensure queries work as expected. Efficient Database design reviewed by peers to confirm efficiency and no data redundancy. |
|
Frontend performance |
Poor implementation may make it unintuitive and hard to use. |
Product |
Technology |
Low |
High |
Effective solutions for how to display chart data will need to be researched. Unit testing to ensure usability. |
|
MVP may give incomplete representation |
Users may be underwhelmed by the MVP as it cannot include all features straightaway. |
Project and product |
Requirements |
Low |
High |
Communicate this is an MVP for the purpose of getting feedback during development and ensure meets user needs. As opposed to big bang release. |
1.5 Approaches to Modularisation
The application is made up of three parts: a frontend, backend and database. To make the codebase more scalable, maintainable and reusable, design patterns have been used (Khan, 2023).
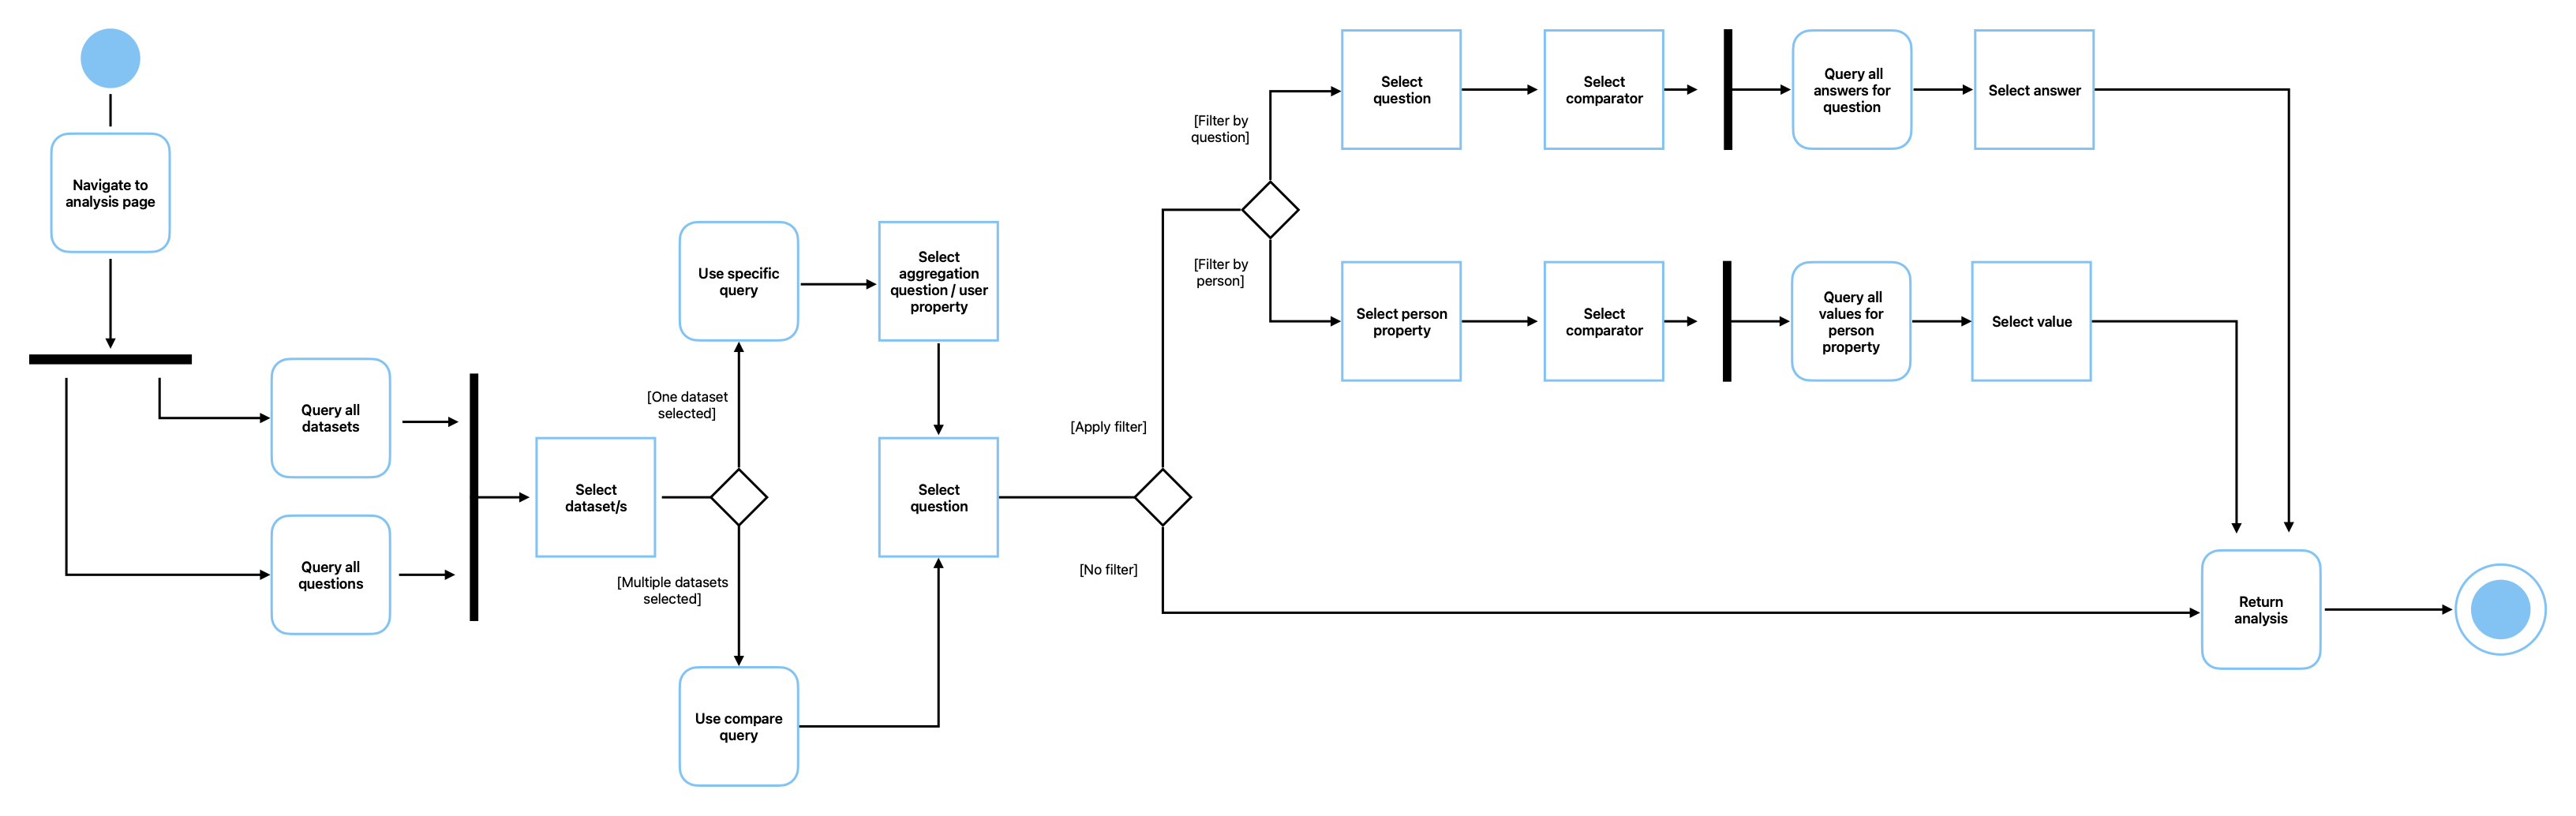
The frontend has been built with React, which allows user interfaces to be built from individual components, written in JavaScript (Meta Open Source, 2025). A CDA value is to make “units of work as small as possible” (Appendix Q) and to achieve that Frost’s (2016) Atomic Design pattern has been used. It involves structuring components as ‘atoms’, ‘molecules’ and ‘organisms’ (Appendix N). The components in appendices R, S and T together allow users to filter results when making a query, a UML activity diagram describing this process can be seen in Figure 11. The atomic design pattern allows us to make small, independent components, enabling us to see how our interfaces break down to form the product (Frost, 2016). This pattern was used as opposed to the compound pattern that creates components dependent on each other with a shared state (Hallie and Osmani, 2021). This pattern was avoided as it neglects to consider Berners-Lee’s (1998) view that if components can be broken down and independent, when change is necessary you only need to understand, change and test that one part. This is a crucial factor for product maintenance and evolution.
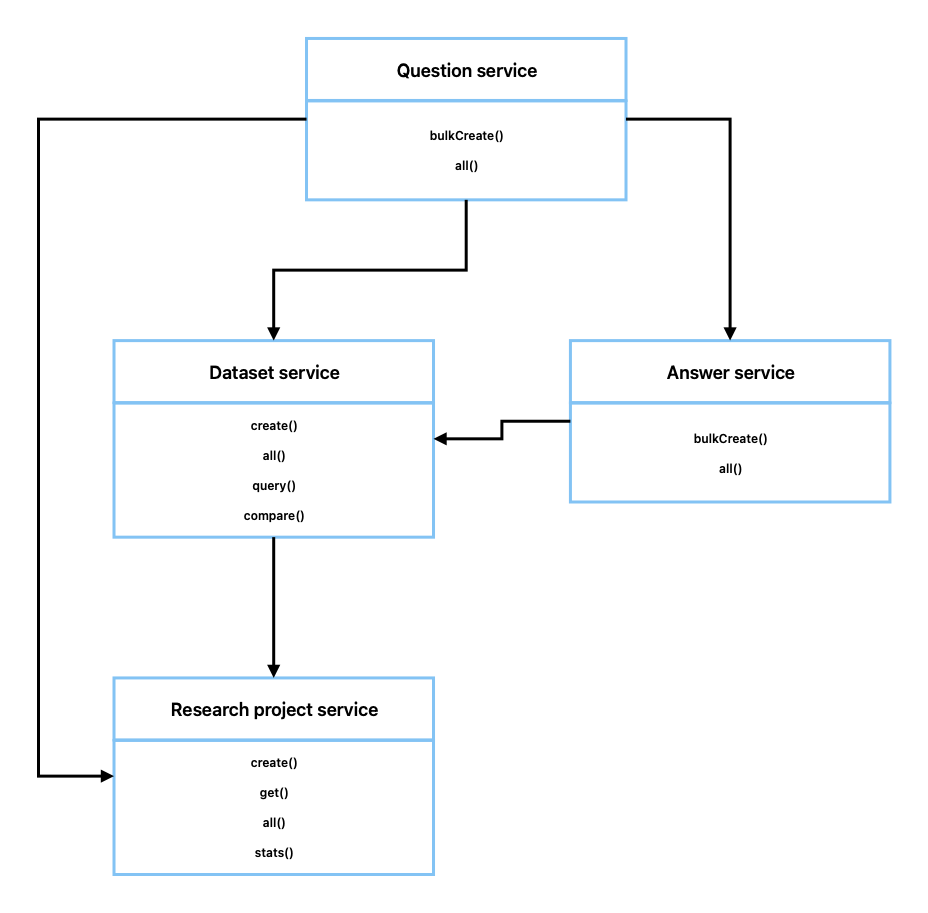
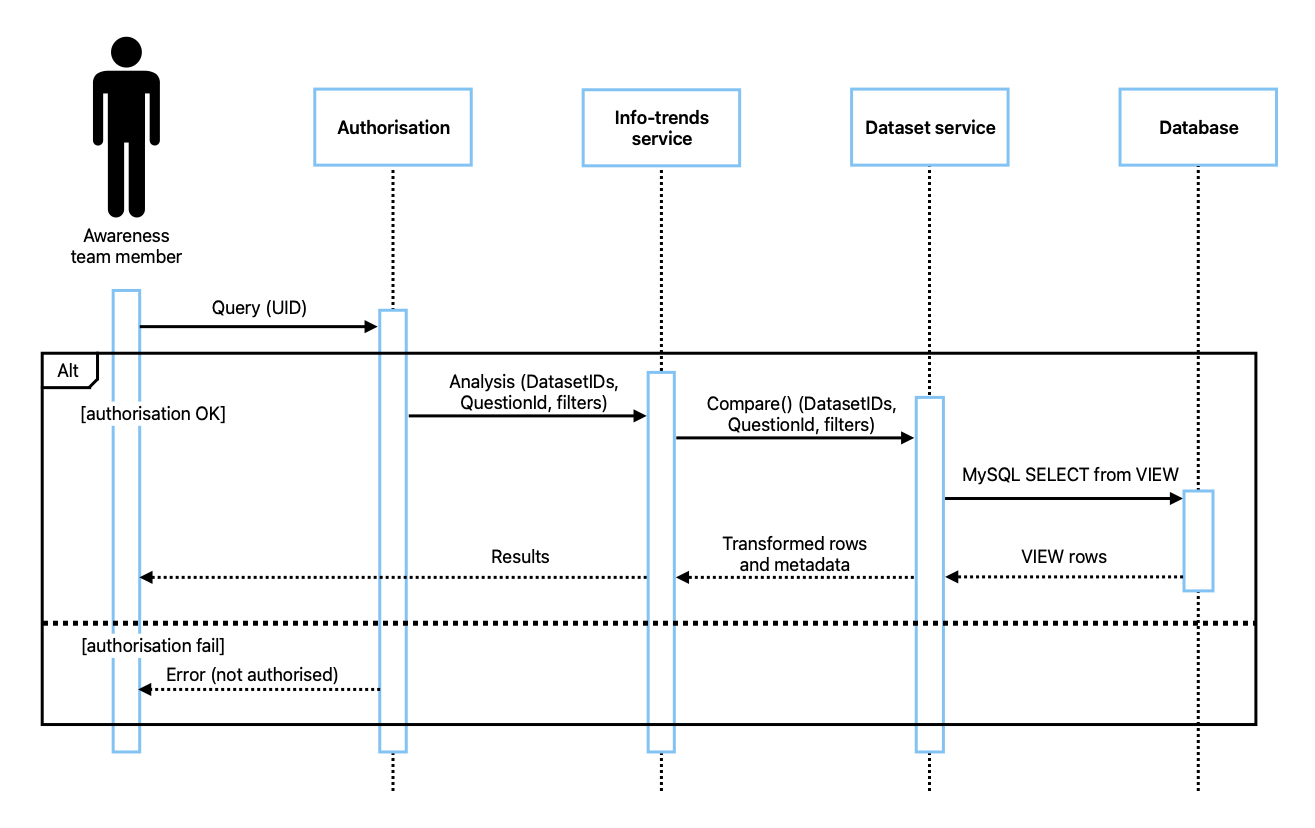
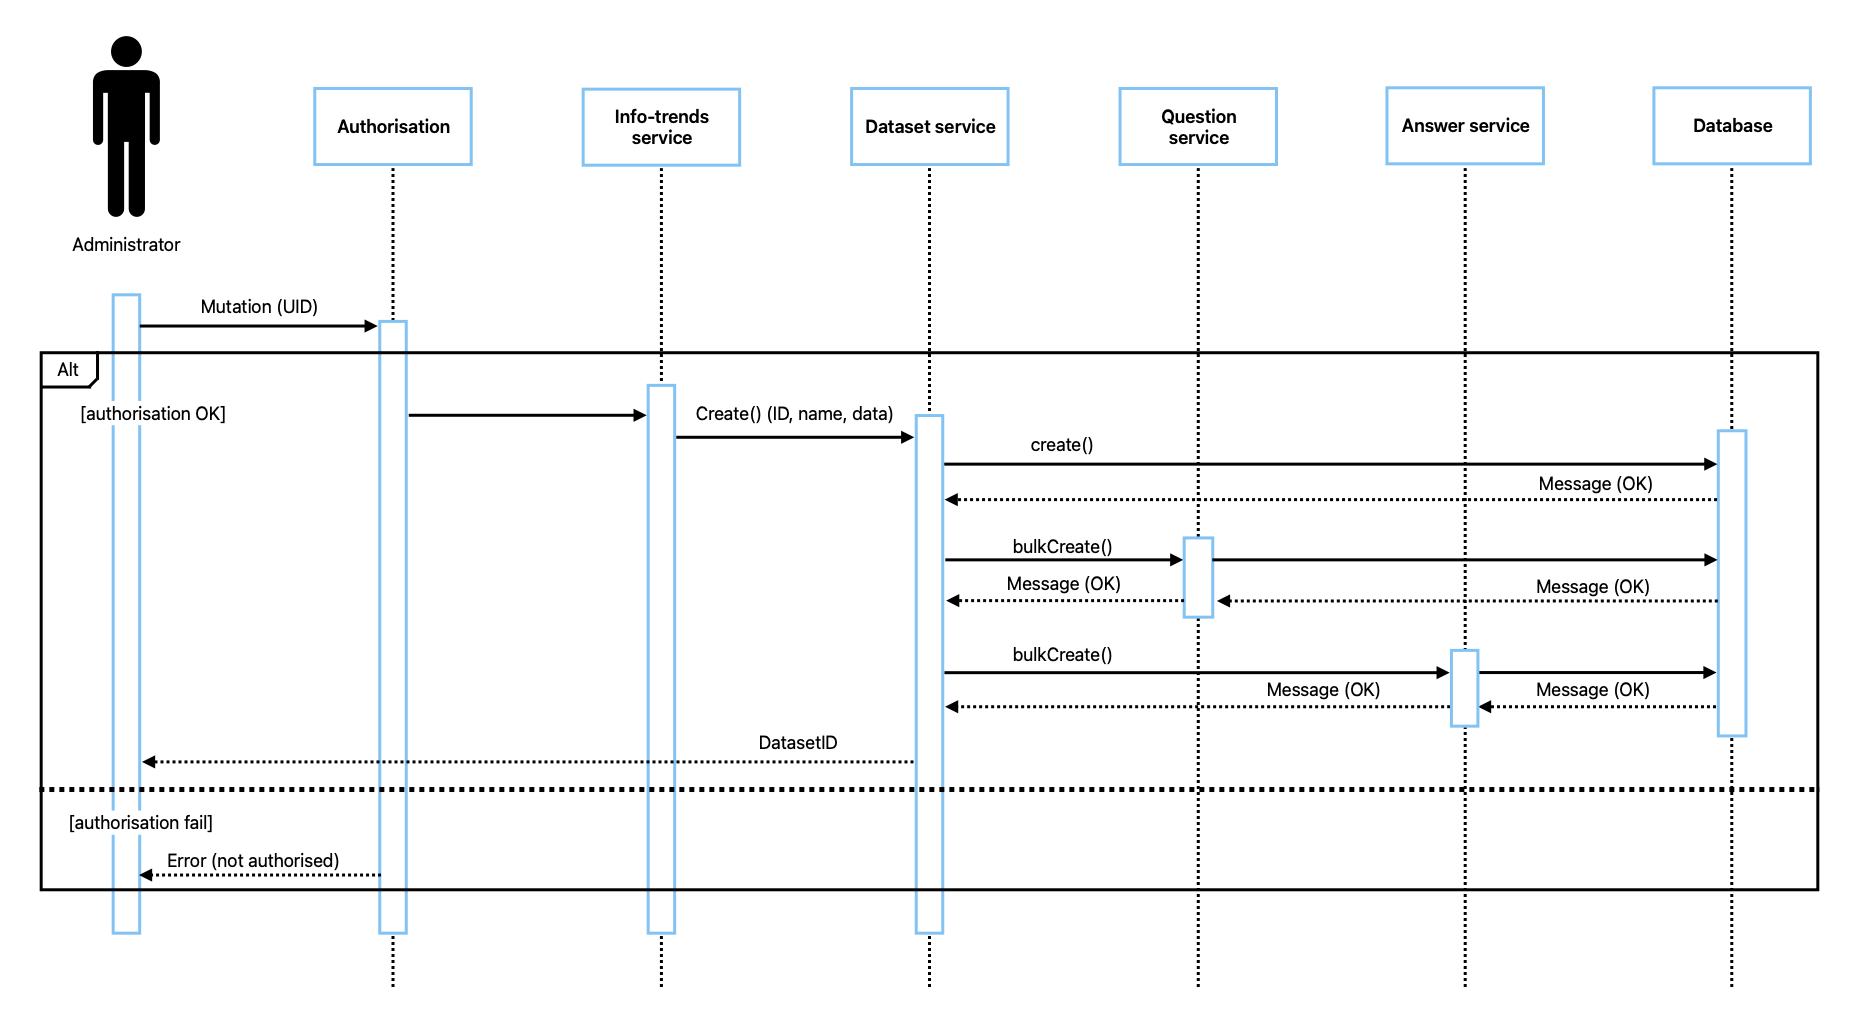
The backend is where business logic and data processing take place to make the application work (AWS, 2025). To ensure that the system can adapt to new requirements the SOLID principles were followed (Radzik, 2025). They are five principles to follow when designing a class structure (Erinç, 2020). The structure of the backend can be seen in the UML class diagram in Figure 9. It follows the single responsibility principle that each service is responsible for a single functionality (Oluwatobi, 2024), with services for handling each of the main areas of the system (Appendices U, V, W and X). In Figures 12-13 UML sequence diagrams can be seen, showing how the services interact to achieve use-cases #1 and #2. With the adoption of a hybrid software-process it is imperative the systems are built in an agile way and allow for change (Stoica, Mircea and Ghilic-Micu, 2013). Berners-Lee (2008) confirms a single responsibility approach caters for change as it allows a module to evolve or be replaced without affecting others.
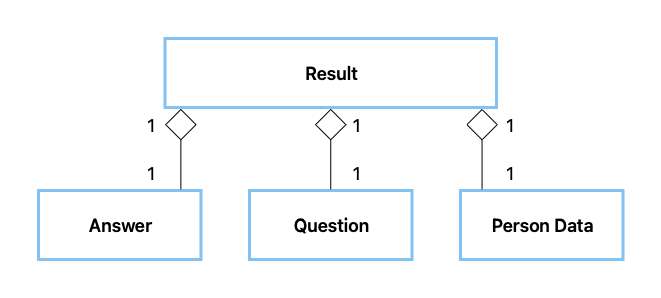
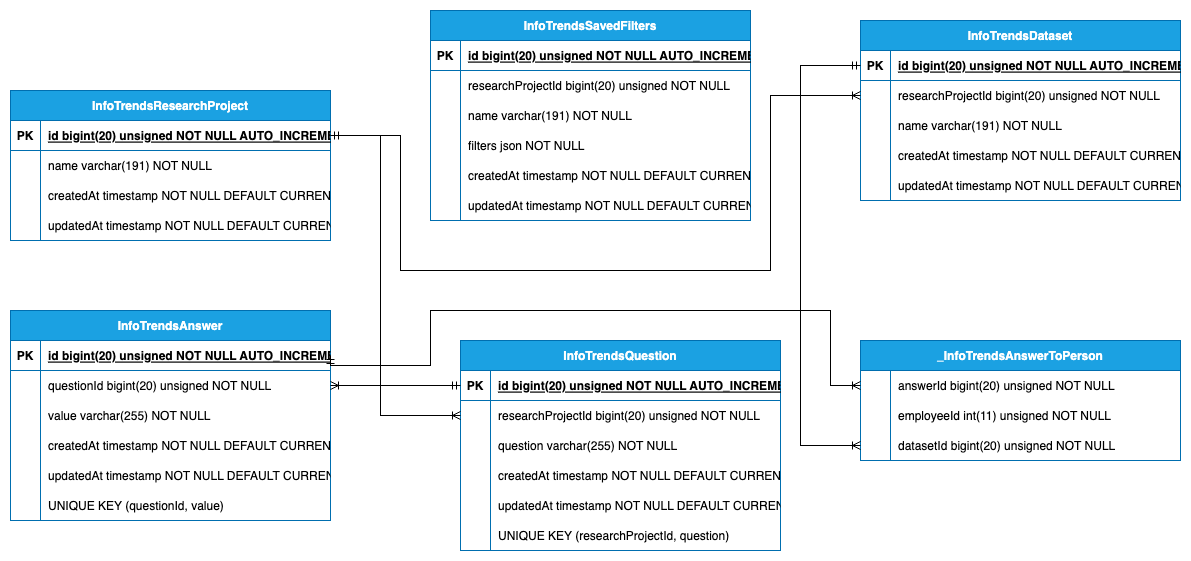
In Figure 14 is an entity relationship diagram showing the database. In Figure 10 a UML aggregation diagram shows how the entities in the database come together to form an analysis result.
Artefact Evaluation and Validation
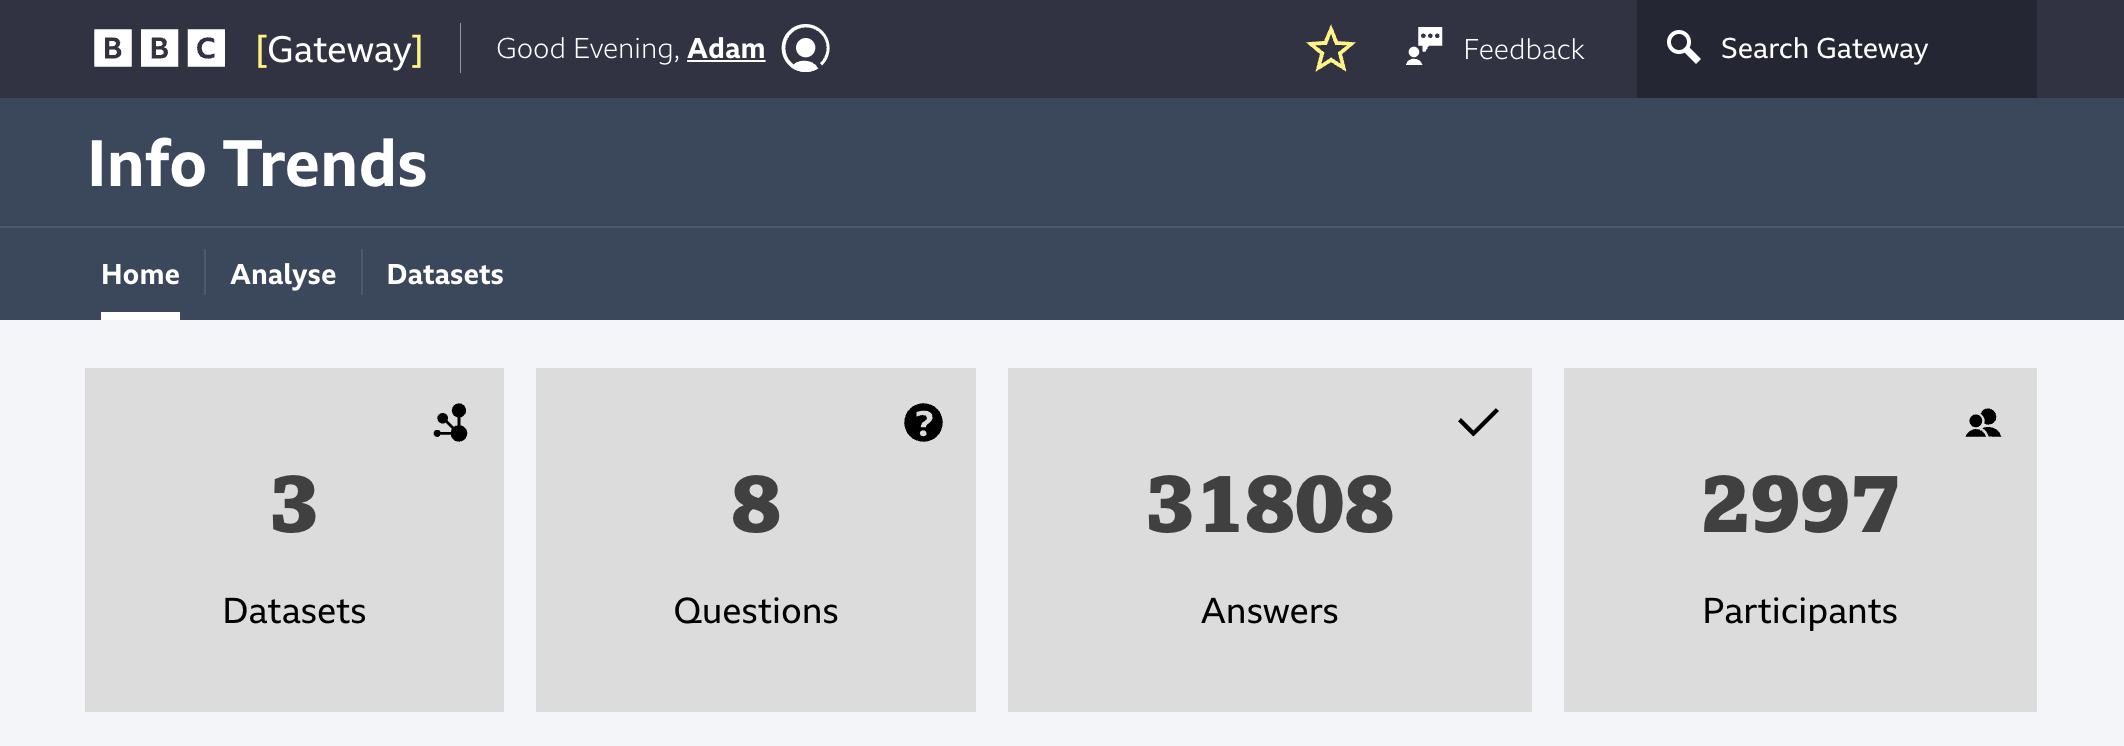
For the system to be successful and contribute to the goals of the cyber-security policy it must identify areas of weak security knowledge amongst staff and meet the “must” have requirements (Clegg and Barker’s, 1994). These can be seen in Table 3. The first is the system must be able to import survey data questioning staff’s knowledge. InfoSec provided 3 datasets at the start of the project, in Figure 15 you can see the dashboard of the system showing an overview of the data, confirming the requirement has been met.
The project is still in the “build” stage of the software-process model (Figure 8) however working iteratively it has allowed the stakeholder to gain value from the product despite not being finished (Middleton and Joyce, 2011). At the end of an iteration a meeting with the stakeholder takes place to review work completed (Jayatilleke and Lai, 2017). The result of this meeting is an acceptance-test-table (Table 6). Each acceptance test case corresponds to a use-case to ensure the system is fit for purpose (Alexander and Maiden, 2004).
The Performance analysis community (2022) recommend collecting data to measure how a system is performing against key performance indicators (KPIs). These can be seen in Table 6.
|
KPI |
Result |
|
Response time |
Average response time for a analysis query was 303ms, ensuring quick data retrieval. |
|
Database performance |
MySQL query execution took an average of 167ms for 3 datasets with 32,000+ rows, ensuring efficient analysis. |
|
System uptime |
AWS guarantee 99.9% uptime. |
Table 1 KPI Results
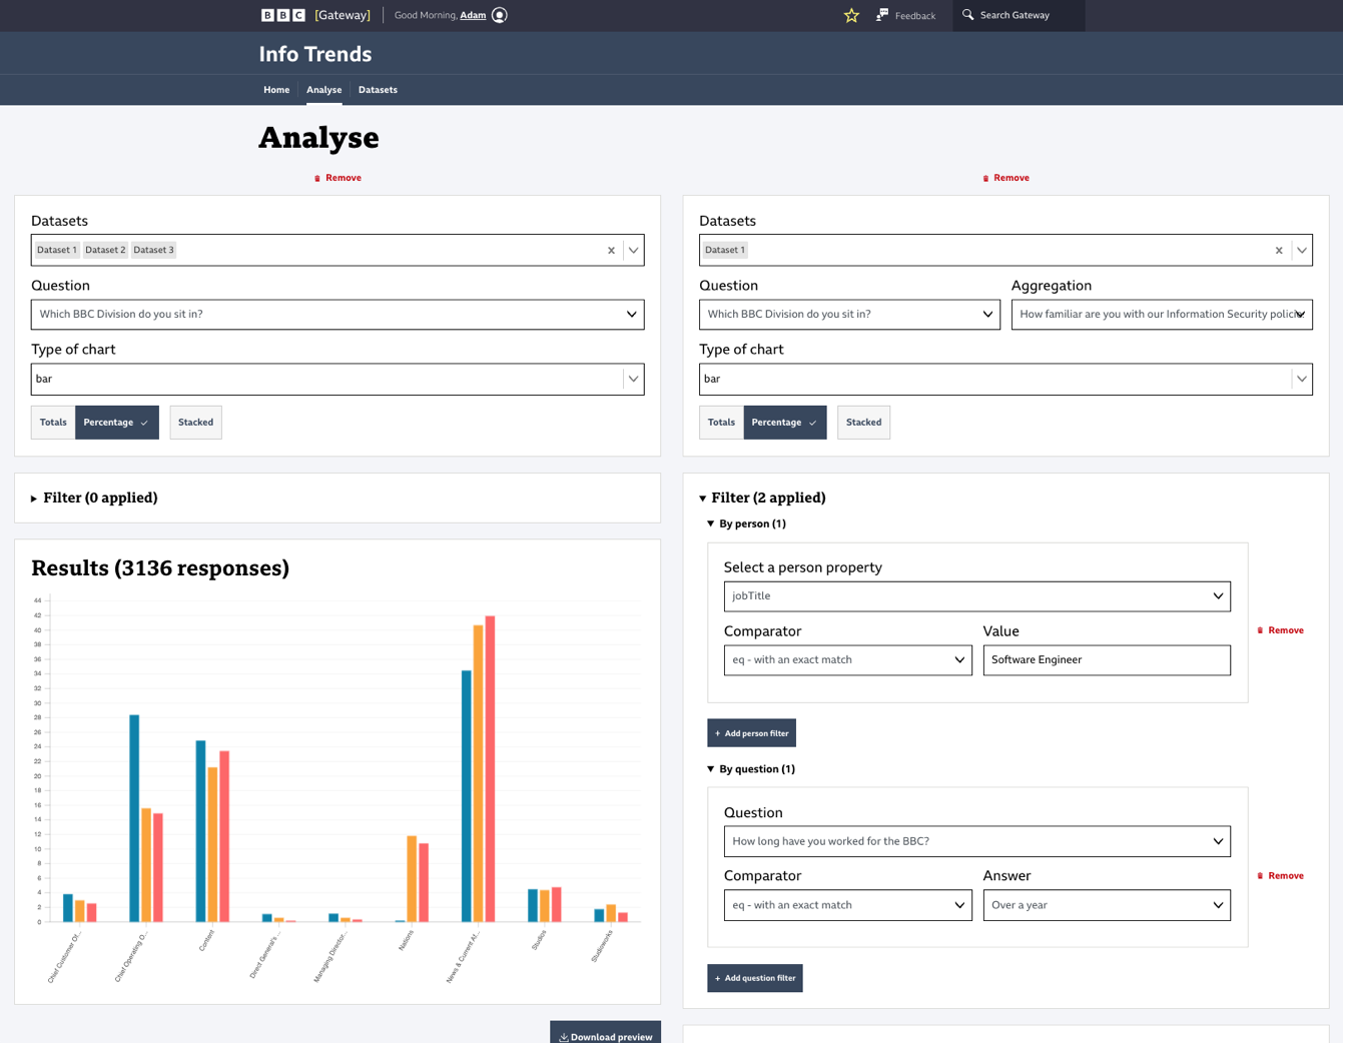
For use-cases 1 and 2 to be successful users must be able to analyse data. Table 7 exemplifies how the requirements to fulfil these use-cases were successful. However, one of the aims of the system was to easily be able to spot trends, currently, this is not optimised. The acceptance tests pass through a solution that gives users the datasets, questions and filters which allow users to configure what they want. In Figure 16 you can see all of the options available when analysing data. This solution was prioritised in accordance with CDA policy to produce MVPs (Appendix G) allowing users to analyse data early, while the rest of the system is being developed. Miller (2023) describes how choice overload can lead to users being less likely to use the product or make a choice when given too many options which is supported by Bakusevych (2021) who explains that data can be represented in different ways but if the user chooses the wrong chart it can lead to data misinterpretation.
With this in mind, it can be concluded that while the requirements for use-cases 1 and 2 pass, the product in its current state is hard to use. It is important that in future iterations use-cases 4 and 5 are prioritised. Providing areas where statistics on specific questions and answers can be viewed, with less freedom for the user to configure what they desire, instead the best chart for the type of data is presented, consequently making it easier to spot trends.
|
No. |
Use case |
Linked requirements |
Fit criterion |
Test result |
Proof |
|
1 |
#1 Compare datasets |
2.1, |
For each dataset there must be a corresponding date |
Pass |
Appendix BB |
|
2.2 |
Numerous datasets should be able to be selected and compared against an aggregation. The output should be a chart displaying all data |
Pass |
Figure 16 |
||
|
2.3 |
The ability to select all imported datasets |
Pass |
Appendix CC |
||
|
3.2 |
Be able to filter results by answers to questions |
Pass |
Appendix DD |
||
|
5.1 |
Names and staff numbers will be hidden throughout the application |
Pass |
N/A |
||
|
8.1 |
Employee staff numbers will be used to cross-reference individual survey results to HR SAP. |
Pass |
N/A |
||
|
8.2, 8.3, 8.4, 8.5, 8.6 |
Be able to filter results by job title, department, division, employee type and building |
Pass |
Appendix DD |
||
|
9.1 |
Output results in the form of bar charts, line charts, area graphs and pie charts |
Fail |
Figure 16 |
||
|
|
|
|
|
|
|
|
2 |
#2 Analyse a dataset |
2.4 |
The system should display all questions in the system to select from. |
Pass |
Figure 16 |
|
3.2 |
Be able to filter results by answers to questions |
Pass |
Appendix DD |
||
|
5.1 |
Names and staff numbers will be hidden throughout the application |
Pass |
N/A |
||
|
8.1 |
Employee staff numbers will be used to cross-reference individual survey results to HR SAP. |
Pass |
N/A |
||
|
8.2, 8.3, 8.4, 8.5, 8.6 |
Be able to filter results by job title, department, division, employee type and building |
Pass |
Appendix DD |
||
|
9.1 |
Output results in the form of bar charts, line charts, area graphs and pie charts |
Fail |
Figure 16 |
||
|
|
|
|
|
|
|
|
3 |
#3 Save insights |
12.2 |
Queries can be saved to the dashboard for easy access |
Fail |
N/A |
|
12.3 |
When making a configuration the settings will be written to the URL as parameters |
Pass |
N/A |
||
|
|
|
|
|
|
|
|
4 |
#4 View answers |
14.1 |
Display all answers on an answers page |
Fail |
N/A |
|
14.2 |
Paginated answers table |
Fail |
N/A |
||
|
14.3 |
An answer detail page showing specific insights |
Fail |
N/A |
||
|
5 |
#5 View questions |
13.1 |
Display all questions on a questions page |
Fail |
N/A |
|
13.2 |
Paginated question table |
Fail |
N/A |
||
|
13.3 |
A question detail page showing specific insights |
Fail |
N/A |
||
|
6 |
#6 View key insights |
12.1 |
The dashboard should provide an overview of how much data is in the system |
Pass |
Figure 15 |
|
7 |
#7 Upload datasets |
1.1 |
Multiple datasets can be imported into the system |
Pass |
Appendix BB |
|
1.2 |
Convert the Excel spreadsheet into JSON for import |
Pass |
N/A |
||
|
3.1 |
Additional questions or answers in later datasets are added to the system |
|
N/A |
||
|
8 |
#8 Export insights |
9.1 |
Output results in the form of bar charts, line charts, area graphs and pie charts |
Fail |
Figure 16 |
Table 1 Acceptance Tests
Personal Reflection
To guide my personal reflection on the undertaking of this project Driscoll’s (2007) Reflective Model has been used as a straightforward way to engage critically.
With CDA recommending agile practices to the wider team and having adopted an agile-influenced hybrid process for this project, continuous refactoring is highly encouraged (Appendix K). During the building phase, requirement 3.2 relied upon results being able to be filtered. Best practises for filtering often consist of variables being included as URL-parameters. Approaches were often cumbersome, and solutions varied amongst the suite of CDA apps. I refactored an approach to handling URL-parameters into a generic hook (Appendix EE), accessible from the shared component library. Developers in the wider team also refactored areas of the codebase, however these often-introduced breaking changes resulting in broken development environments and bugs in apps. While Alexander and Maiden (2004) suggest continuous refactoring in XP maintains the integrity of a system, my experience aligned with Jarosz’s (2025) where refactoring can block tasks other developers are working on. While XP is influential in enabling successful software development, despite vague requirements, it appears to make some assumptions that the team is working in isolation which does not apply in the case of CDA where there are 6 sub-teams all working in one monorepo. While the sub-teams are necessary to meet the “perfect team size” (Hackman and Vidmar, 1970), in the future I will try Sutherland’s (2001) Scum-of-Scrums where team leaders from each team meet periodically to discuss work, including refactoring, that may affect other teams, with the aim of improving communication.
While this project has enhanced my agile and requirement elicitation skills I have learnt that the context of the team, including organisational structure, can affect how well software-processes are carried out. I learned that communication across teams is crucial for maintaining code quality, particularly when refactoring shared components.
References
Alexander, I. and Maiden, N. (2004) Scenarios, Stories, Use Cases: Through the Systems Development Life-Cycle. New Jersey: Wiley
Ali, Z. (2024) The Weaknesses and Strengths of Layered Architecture in Software Development. Available at: https://zeeshan01.medium.com/the-weaknesses-and-strengths-of-layered-architecture-in-software-development-81ba1206a17b (Accessed: 14 March 2025).
Aschenbrenner, J. (2024) The Power of Prototyping in Business Analysis. Available at: https://thebaguide.com/blog/the-power-of-prototyping-in-business-analysis/ (Accessed: 25 February 2025).
Atlassian (2024) The Agile Coach. Available at: https://www.atlassian.com/agile (Accessed: 10 March 2025).
AWS (2025) What’s the Difference Between Frontend and Backend in Application Development?. Available at: https://aws.amazon.com/compare/the-difference-between-frontend-and-backend/ (Accessed: 14 March 2025).
Bailey, D. (2016) What is GEL?. Available at: https://www.bbc.co.uk/gel/features/what-is-gel (Accessed: 4 March 2025).
Bakusevych, T. (2021) 20 ideas for better data visualization. Available at: https://uxdesign.cc/20-ideas-for-better-data-visualization-73f7e3c2782d (Accessed: 21 March 2025).
BBC (2021) BBC to move key jobs and programmes out of London. Available at: https://www.bbc.co.uk/news/entertainment-arts-56433109 (Accessed: 16 March 2025).
BBC (2024) Mission, values and public purposes. Available at: https://www.bbc.com/aboutthebbc/governance/mission (Accessed: 1 March 2025)
BBC (2025) Learn more about what we do. Available at: https://www.bbc.com/aboutthebbc/ (Accessed: 17 March 2025).
BBC Press Office (2022) Plan to deliver a digital-first BBC. Available at: https://www.bbc.co.uk/mediacentre/2022/plan-to-deliver-a-digital-first-bbc/ (Accessed: 10 March 2025).
Beedle, M., et al. (2001) Manifesto for Agile Software Development. Available at: https://agilemanifesto.org/ (Accessed: 10 March 2025).
Berners-Lee, T. (1998) Principles of Design. Available at: https://www.w3.org/DesignIssues/Principles (Accessed: 14 March 2025).
Berners-Lee, T. (2008) Modularity. Available at: https://www.w3.org/DesignIssues/Modularity.html (Accessed: 14 March 2025).
Bødker, S. and Grønbæk, K (1991) ‘Cooperative prototyping: users and designers in mutual activity’, International Journal of Man-Machine Studies, 34(3), pp. 453-478. Available at: https://doi.org/10.1016/0020-7373(91)90030-B (Accessed: 2 March 2025).
Bosch, J. (1999) ‘Design and Use of Software Architectures’, Technology of Object-Oriented Languages and Systems. 22-25 Sept. Available at: http://dx.doi.org/10.1109/TOOLS.1999.779093 (Accessed: 16 March 2025).
Clark, A. (2009) Walls Come Tumbling Down presentation slides and transcript. Available at: https://stuffandnonsense.co.uk/blog/walls_come_tumbling_down_presentation_slides_and_transcript (Accessed: 26 March 2025).
Clegg, D. and Barker, R. (1994) Case Method Fast Track: A Rad Approach. London: Addison Wesley.
Cockburn, A. (2000) Writing Effective Use Cases. Boston: Addison-Wesley Professional.
Cohn, M. (2023) Agile Succeeds Three Times More Often Than Waterfall. Available at: https://www.mountaingoatsoftware.com/blog/agile-succeeds-three-times-more-often-than-waterfall (Accessed: 12 March 2025).
Corera, G. (2016) How France's TV5 was almost destroyed by 'Russian hackers'. Available at: https://www.bbc.co.uk/news/technology-37590375 (Accessed: 18 March 2025).
De Lucia, A. and Qusef, A. (2010) ‘Requirements Engineering in Agile Software Development’, Journal of Emerging Technologies in Web Intelligence, 2(3), pp. 212–220. Available at: https://doi.org/10.4304/JETWI.2.3.212-220 (Accessed: 1 March 2025).
Design Community (2019) Map and understand a user's whole problem. Available at: https://www.gov.uk/service-manual/design/map-a-users-whole-problem (Accessed: 5 March 2025).
Downey, P. (2014) Principles for prototyping. Available at: https://gds.blog.gov.uk/2014/06/03/principles-for-prototyping/ (Accessed: 1 March 2025)
Doyle, J. and Pope, R. (2016) Learning through prototyping: tools for Universal Credit claimants. Available at: https://dwpdigital.blog.gov.uk/2016/02/19/learning-through-prototyping-tools-for-universal-credit-claimants/ (Accessed: 1 March 2025).
Driscoll, J. (2007) Practising clinical supervision: a reflective approach for healthcare professionals. 2nd edn. Edinburgh : Ballière Tindall/Elsevier
Erinç, Y. (2020) The SOLID Principles of Object-Oriented Programming Explained in Plain English. Available at: https://www.freecodecamp.org/news/solid-principles-explained-in-plain-english/ (Accessed: 14 March 2025).
Fakhroutdinov, K. (2025) UML Use Case. Available at: https://www.uml-diagrams.org/use-case.html (Accessed: 6 March 2025).
Firesmith, D. (2004) Use Cases: the Pros and Cons. Available at: https://www.cs.hmc.edu/~mike/courses/mike121/readings/reqsModeling/firesmith.htm (Accessed: 7 March 2025).
Frost, B. (2016) Atomic Design. Available at: https://atomicdesign.bradfrost.com/table-of-contents/ (Accessed: 3 March 2025).
Government Digital Service (2012) Government Design Principles. Available at: https://www.gov.uk/guidance/government-design-principles (Accessed: 1 March 2025).
Gupta, R. (2024) Software Architecture Patterns: What Are the Types and Which Is the Best One for Your Project. Available at: https://www.turing.com/blog/software-architecture-patterns-types (Accessed: 16 March 2025).
Hackman, R, and Vidmar, N. (1970) ‘Effects of Size and Task Type on Group Performance and Member Reactions’, Sociometry, 33, pp. 37-54. Available at: https://doi.org/10.2307/2786271 (Accessed: 20 March 2025).
Hall, E. (1998) Managing Risk: Methods for Software Systems Development. Boston: Addison-Wesley Professional.
Hallie, L. and Osmani, A. (2021) Learning Patterns. Available at: https://books.apple.com/us/book/learning-patterns/id1591084282 (Accessed: 14 March 2025).
Hammond, R. and Phillips, A. (2023) Launch of the new GOV.UK Prototype Kit. Available at: https://gds.blog.gov.uk/2023/02/14/launch-of-the-new-gov-uk-prototype-kit/ (Accessed: 1 March 2025).
Ibrahim, M. (2023) ReactJS — Advantages & Disadvantages. Available at: https://medium.com/@muhamedsalihseyedibrahim/reactjs-advantages-disadvantages-16f479b3aa47 (Accessed: 18 March 2025).
Inayat, I., et al. (2015) ‘A systematic literature review on agile requirements engineering practices and challenges’, Computers in Human behaviour, 51(B), pp. 915-929. Available at: https://doi.org/10.1016/j.chb.2014.10.046 (Accessed: 28 February 2025)
Jacobson, I. and Cockburn, A. (2023) ‘Use Cases are Essential: Use cases provide a proven method to capture and explain the requirements of a system in a concise and easily understood format.’, ACM QUEUE, 21(5), pp. 66-86. Available at: https://doi.org/10.1145/3631182 (Accessed: 6 March 2025).
Jacobson, I. and Spence, I. (2024) Use Cases - The Ultimate Guide. Available at: https://www.ivarjacobson.com/publications/articles/use-cases-ultimate-guide (Accessed: 5 March 2025).
Jacobson, I., Spence, I. and Kerr, B. (2016) ‘Use-Case 2.0: The Hub of Software Development’, ACM QUEUE, 14(1), pp. 94-123. Available at: https://doi.org/10.1145/2898442.2912151 (Accessed: 7 March 2025).
Jarosz, P. (2025) The benefits and pitfalls of code refactoring. Available at: https://www.rst.software/blog/the-benefits-and-pitfalls-of-code-refactoring (Accessed: 20 March 2025)
Jayatilleke, S. and Lai, R. (2017) ‘A systematic review of requirements change management’, Information and Software Technology, pp. 163-185. Available at: https://doi.org/10.1016/j.infsof.2017.09.004 (Accessed: 22 February 2025).
Katariya, L. (2023) How to Choose the Right Framework: React vs Angular. Available at: https://www.brilworks.com/blog/react-vs-angular/ (Accessed: 18 March 2025).
Khan, S. (2023) Design Patterns and Their Benefits. Available at: https://dev.to/sardarmudassaralikhan/design-patterns-and-their-benefits-2ngk (Accessed: 14 March 2025).
Kuhrmann, M., et al. (2019) ‘Hybrid Software Development Approaches in Practice: A European Perspective’, IEEE Software, 36(4), pp. 20-31. Available at: https://doi.org/10.1109/MS.2018.110161245 (Accessed: 6 March 2025).
Kyng, M. (1995) ‘Making Representations Work’, Communications of the ACM, 38(9), pp. 46-55. Available at: https://doi.org/10.1145/223248.223261 (Accessed: 2 March 2025).
Lei, H., et al. (2015) ‘A statistical analysis of the effects of Scrum and Kanban on software development projects’, Robotics and Computer-Integrated Manufacturing, 43, pp. 59-67. Available at: https://doi.org/10.1016/j.rcim.2015.12.001 (Accessed: 10 March 2025).
Martin, L. (2025) Why the Latest JavaScript Frameworks Are a Waste of Time. Available at: https://dev.to/holasoymalva/why-the-latest-javascript-frameworks-are-a-waste-of-time-52pc (Accessed: 18 March 2025).
Meta Open Source (2025) React. Available at: https://react.dev/ (Accessed: 14 March 2025).
Middleton, P. and Joyce, D. (2011) ‘Lean Software Management: BBC Worldwide Case Study’, IEEE Transactions on Engineering Management, 59(1), pp. 20-32. Available at: https://doi.org/10.1109/TEM.2010.2081675 (Accessed: 11 February 2025).
Mietzner, D. and Reger, G. (2005) ‘Advantages and Disadvantages of Scenario Approaches for Strategic Foresight’, International Journal of Technology Intelligence and Planning, 1(2), pp. 220-239. Available at: https://doi.org/10.1504/IJTIP.2005.006516 (Accessed: 7 March 2025).
Miller, E. (2023) The Impact of Choice Overload in UX. Available at: https://medium.com/@evamiller091/the-impact-of-choice-overload-in-ux-f5defb6cee5d (Accessed: 21 March 2025).
Moore, M. (2025) Top Cybersecurity Threats to Watch in 2025. Available at: https://onlinedegrees.sandiego.edu/top-cyber-security-threats/ (Accessed: 18 March 2025).
Murphy, B., et al. (2013) ‘Have Agile Techniques been the Silver Bullet for Software Development at Microsoft’, Proceedings of the Seventh International Symposium on Empirical Software Engineering and Measurement. 10-11 Oct Baltimore USA. Available at: http://dx.doi.org/10.1109/ESEM.2013.21 (Accessed: 6 March 2025).
National Audit Office (2012) Governance for Agile delivery. Available at: https://www.nao.org.uk/wp-content/uploads/2012/07/governance_agile_delivery.pdf (Accessed: 25 February 2025).
O’Kane, P. (2024) Transforming the BBC. Available at: https://www.bbc.co.uk/mediacentre/articles/2024/transforming-the-bbc/ (Accessed: 12 March 2025).
Oluwatobi (2024) How to Build Resilient Microservice Systems – SOLID Principles for Microservices. Avialable at: https://www.freecodecamp.org/news/solid-principles-for-microservices/ (Accessed: 14 March 2025).
Pandey, S. (2024) Mastering Client-Server Architecture. Available at: https://medium.com/@santoshpandey987/mastering-client-server-architecture-260cbac2a0b9 (Accessed: 16 March 2025).
Performance analysis community (2022) Using performance data to improve your service: an introduction. Available at: https://www.gov.uk/service-manual/measuring-success/using-data-to-improve-your-service-an-introduction (Accessed: 25 March 2025).
Petersen, K. and Wohlin, C. (2009) ‘A comparison of issues and advantages in agile and incremental development between state of the art and an industrial case’, Journal of Systems and Software, 82(9), pp. 1479-1490. Available at: https://doi.org/10.1016/j.jss.2009.03.036 (Accessed: 9 March 2025).
Pitt, S. (2020) About me. Available at: https://www.pittster.co.uk/about (Accessed: 12 March 2025).
Product and service community (2018) Deciding on priorities. Available at: https://www.gov.uk/service-manual/agile-delivery/deciding-on-priorities (Accessed: 9 March 2025).
Radzik, K. (2025) SOLID, CUPID & GRASP – three (more) principles that every developer should know about. Available at: https://www.boldare.com/blog/solid-cupid-grasp-principles-object-oriented-design/ (Accessed: 14 March 2025).
Rehemägi, T. (2021) Cutting AWS Lambda Costs: Tried and Tested Strategies. Available at: https://aws.plainenglish.io/cutting-aws-lambda-cost-tried-and-tested-strategies-ea5d972fd00 (Accessed: 16 March 2025).
Sami, M. (2012). Software Development Life Cycle Models and Methodologies. Available at: https://melsatar.blog/2012/03/15/software-development-life-cycle-models-and-methodologies/ (Accessed: 21 February 2025).
Sami, M. (2018) What is the Waterfall Model (Waterfall Methodology)?. Available at: https://melsatar.blog/2018/02/16/the-waterfall-model-a-different-perspective/ (Accessed: 10 March 2025).
Scacchi, W. (2001) ‘Process Models in Software Engineering’ Available at: https://ics.uci.edu/~wscacchi/Papers/SE-Encyc/Process-Models-SE-Encyc.pdf (Accessed: 21 February 2025).
Smith, D., et al. (2021) ‘State of DevOps 2021’ Google Cloud Accelerate. Available at: https://services.google.com/fh/files/misc/state-of-devops-2021.pdf (Accessed: 6 March 2025).
Sommerville, I. (2015) Software Engineering. 10th edn. London: Pearson.
Sommerville, I. (2019) Engineering Software Products: An Introduction to Modern Software Engineering. London: Pearson.
State of JS (2024) Libraries. Available at: https://2024.stateofjs.com/en-US/libraries/ (Accessed: 2024).
Stoica, M., Mircea, B. and Ghilic-Micu, B. (2013) ‘Software Development: Agile vs. Traditional’, Informatica Economica, 17(4), pp. 64-76. Available at: http://dx.doi.org/10.12948/issn14531305/17.4.2013.06 (Accessed: 10 March 2025).
Suthar, P. (2024) Angular vs. React vs. Vue: Which Frontend Framework Should You Choose in 2025?. Available at: https://www.zealousys.com/blog/angular-vs-react-vs-vue/ (Accessed: 27 March 2025).
Sutherland, J. (2001) ‘Agile Can Scale: Inventing and Reinventing SCRUM in Five Companies’, Cutter It Journal-the Journal of Information Technology Management, 14(12), pp. 5-11. Available at: https://jeffsutherland.com/papers/scrum/Sutherland2001AgileCanScaleCutter.pdf (Accessed: 20 March 2025).
Talreja, A. (2023) Agile vs. Waterfall: Comparing Project Management Approaches. Available at: https://medium.com/teaching-agile/agile-vs-waterfall-comparing-project-management-approaches-b1d1a7c9c08c (Accessed: 10 March 2025).
Tornqvist, M. (2023) The Importance of Requirements Gathering in Software Development. Available at: https://medium.com/design-bootcamp/the-importance-of-requirements-gathering-in-software-development-a8102b1f666e (Accessed: 24 March 2025).
Vasudev, V. (2023) BRIEF: Pros and cons of aws lambda. Available at: https://vinuvasudev.medium.com/pros-and-cons-of-aws-lambda-2b754c4aae6f (Accessed: 19 March 2025).
Zacarias, D. (2022) 20 Product Prioritization Techniques: A Map and Guided Tour. Available at: https://foldingburritos.com/blog/product-prioritization-techniques/ (Accessed: 9 March 2025).